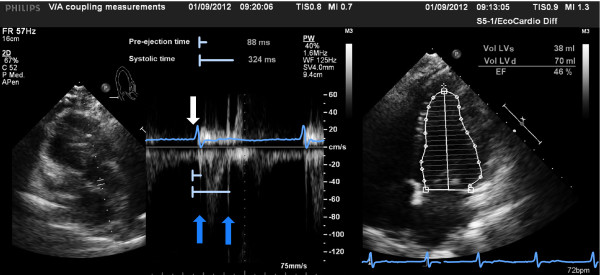
Figure 2.

Echocardiographic measurements of left ventricular (LV) time intervals (left) and LV ejection fraction (EF, right). The white arrow indicates the beginning of the QRS complex, the dark blue arrows indicate the aortic valve opening and closure. The light blue lines show the time interval measurements.
