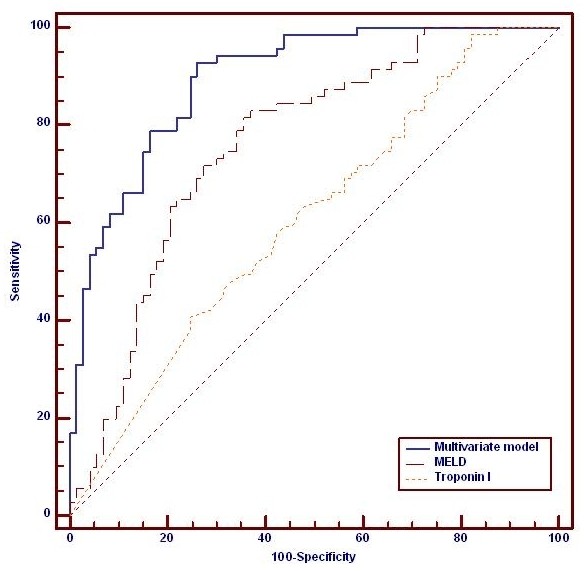
Figure 1.

Comparison of outcome prediction in this cohort between troponin I, MELD and a composite multivariate model using the independent variables from Table 3. Troponin I (AUROC 0.61 (0.52 to 0.68)); MELD (0.76 (0.68 to 0.83); Composite model (AUROC 0.89 (0.83 to 0.94)), P < 0.001 for all comparisons. AUROC, area under the receiver operating curve; MELD, model for end-stage liver disease.
