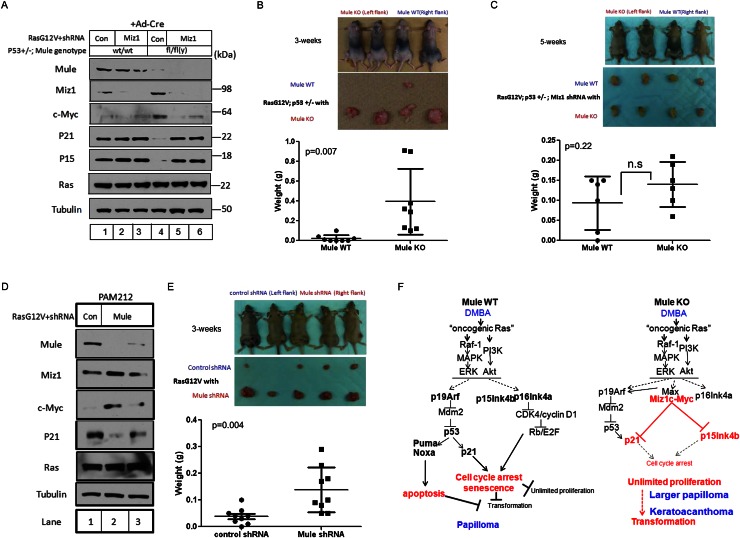
Figure 7.
Mule deficiency promotes Ras-induced tumorigenesis in vivo through a mechanism involving Miz1. (A) Immunoblotting to detect the indicated proteins in lysates of primary MEFs from Mulewt/wt;p53+/− (lanes 1–3) or Mulefl/fl(y);p53+/− (lanes 4–6) mice that were exposed to Ad-Cre for 24 h, followed by retroviral infection with pMX-RasG12V-IRES-Puror-control shRNA (lanes 1,4) or pMX-RasG12V-IRES-Puror-Miz1 shRNA (lanes 2,3,5,6). (B) Transformed control or Mule-deficient MEFs from the cultures in A were subcutaneously injected (1 × 10⁶ cells) into the right (Mule WT) (A, lane 1) or left (Mule KO) (A, lane 4) flanks of athymic nude mice. (Top) Representative photos of four mice per group are shown at 3 wk post-injection. (Middle) Gross views of representative tumors isolated from the mice in the top panel. (Bottom) Weights of tumors of injected mice at 3 wk post-injection. Data points are tumor weight per individual mouse. (Horizontal line) Mean weight ± SD for the group (n = 8). P-value is from unpaired Student’s t-test. (C) Transformed control or Mule-deficient MEFs expressing Miz1 shRNA (from the cultures in A) were subcutaneously injected (1 × 10⁶ cells) into the right (Mule WT-Miz1 shRNA) (A, lane 2) or left (Mule KO-Miz1 shRNA) (A, lane 5) flanks of athymic nude mice. (Top) Representative photos of four mice per group at 5 wk post-injection. (Middle) Gross views of representative tumors isolated from the mice in the top panel. (Bottom) Weights of tumors of injected mice at 5 wk post-injection. Data points are tumor weight per individual mouse. (Horizontal line) Mean weight ± SD for the group (n = 6). P-value is from unpaired Student’s t-test. (D) Immunoblotting to detect the indicated proteins in PAM212 cells infected with pMX-RasG12V-IRES-puror-control shRNA (Con) or pMX-RasG12V-IRES-puror-Mule shRNA (Mule). (E) The control or Mule-depleted PAM212 cells in D were subcutaneously injected (1 × 10⁶ cells) into the left (control shRNA) (D, lane 1) or right (Mule shRNA) (D, lane 2) flanks of athymic nude mice. (Top) Representative photos of five control and five Mule-depleted mice at 3 wk post-injection. (Middle) Gross views of representative tumors isolated from the mice in the top panel. (Bottom) Tumors of injected mice at 3 wk post-injection. Data points are tumor weight per individual mouse. (Horizontal line) Mean weight ± SD for the group (n = 9). P-value is from unpaired Student’s t-test. (F) Proposed model for the role of Mule in cancer. (Left) In wild-type cells exposed to DMBA/PMA, oncogenic Ras signaling induces cell cycle arrest, senescence, and/or apoptosis through activation of the p19Arf–p53–p21 and p16/p15–Retinoblastoma (Rb) tumor suppressor pathways. Unlimited cellular proliferation and transformation are blocked. Thus, wild-type mice exposed to DMBA/PMA develop only small benign tumors such as papillomas. (Right) In Mule-deficient cells exposed to DMBA/PMA, c-Myc/Miz1 complexes that have accumulated due to the lack of Mule prevent p21 and p15 induction by oncogenic Ras signaling. This down-regulation of p21 and p15 weakens the cell cycle arrest/senescence/apoptosis barrier against unlimited proliferation and transformation. Thus, Mule-deficient mice exposed to DMBA/PMA develop larger papillomas and KA.

