Figure 1.
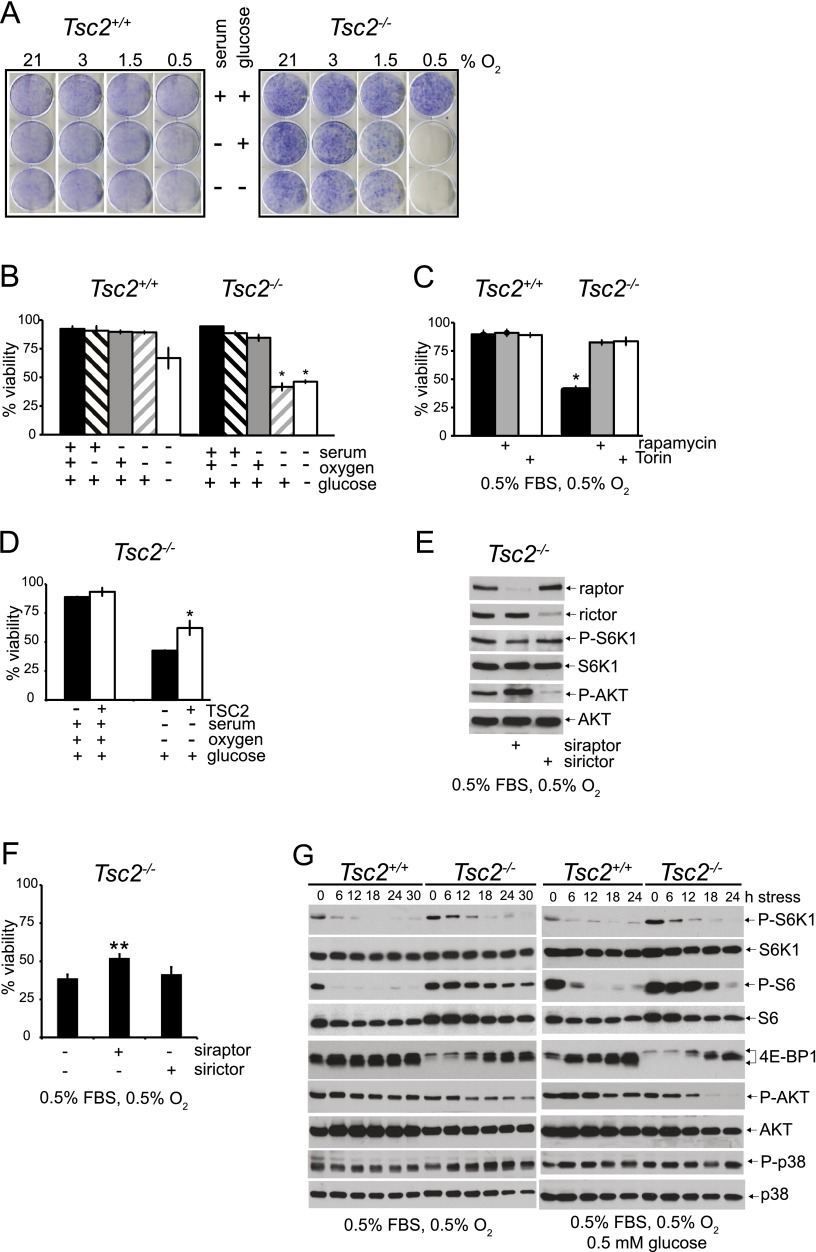
Constitutive mTOR activity promotes cell death under tumor-like stress. (A) To assay the survival of Tsc2+/+, p53−/− and Tsc2−/−, p53−/− MEFs under stress, cells were exposed to 21%, 3%, 1.5%, or 0.5% O2 for 48 h in replete (10% FBS, 5 mM glucose), S (0.5% FBS, 5 mM glucose), and SG (0.5% FBS, 0.5 mM glucose) media and then cultured for seven additional days in replete medium at 21% O2. Colonies were stained with crystal violet (see also Supplemental Fig. S1E). (B) Viability of Tsc2+/+, p53−/− and Tsc2−/−, p53−/− MEFs under stress was also determined by exposing cells to 21% or 0.5% O2 for 48 h in replete, S, or SG medium, and cell survival was analyzed by flow cytometry (P < 0.001) (see also Supplemental Fig. S1A,B,F). (C) The mTORC1 dependence of the survival phenotype was confirmed by rescuing Tsc2−/−, p53−/− MEF cell death under SO limitation with 20 nM rapamycin and 250 nM torin (see also Supplemental Fig. S1C,H). (D) Viability of Tsc2−/− MEFs expressing wild-type TSC2 or an empty control vector was examined by exposing cells to replete and SO conditions for 48 h. Cell survival was analyzed by flow cytometry (P < 0.001). (E) Pools of Tsc2−/−, p53−/− MEFs were depleted of raptor or rictor protein using siRNAs and cultured under SO conditions. The degree of knockdown as well as the effect on mTORC1 and AKT signaling was determined by probing for raptor and rictor protein abundance and for the phosphorylation status of S6K1, S6, and AKT by Western blot. (F) Pools of Tsc2−/−, p53−/− MEFs were depleted of raptor by siRNA treatment and cultured under SO conditions. After 48 h, viability was assessed by flow cytometry (P < 0.001). (G) mTORC1, AKT, and MAPK signaling in Tsc2+/+, p53−/− and Tsc2−/−, p53−/− MEFs under SO conditions for 0, 6, 12, 18, 24, and 30 h and SOG conditions for 0, 6, 12, 18, and 24 h was analyzed by blotting for the phosphorylation status of S6K1, S6, 4E-BP1, AKT, and p38 (see also Supplemental Fig. S1D,G).

