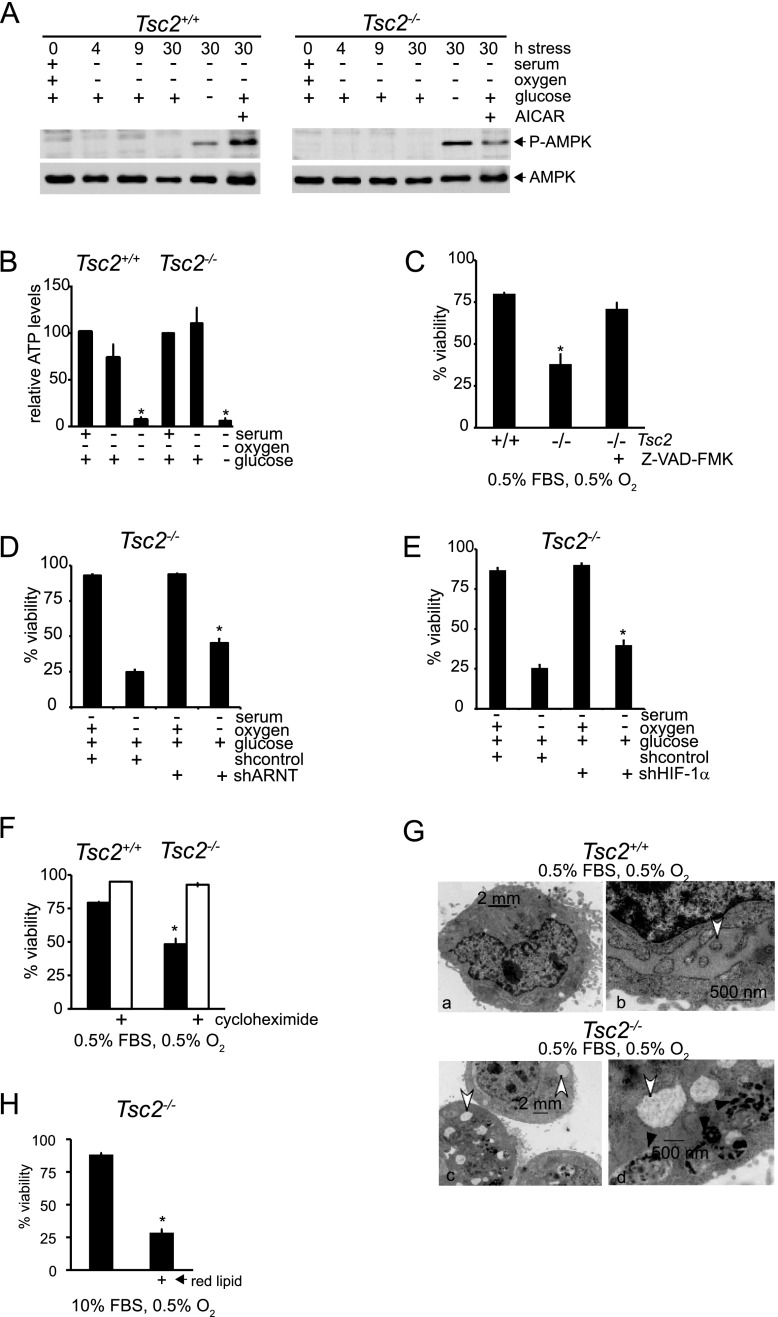
Figure 2.
Tsc2−/−, p53−/− MEFs maintain intracellular bioenergetics under serum and O2 limitation. (A) The energetic status of Tsc2+/+, p53−/− and Tsc2−/−, p53−/− MEFs in SO conditions was evaluated by assaying the phosphorylation status of AMPK (Thr 172) at 0, 4, 9, and 30 h and in the presence of 1 mM AICAR or SOG medium for 30 h. (B) Relative ATP levels were determined in Tsc2+/+, p53−/− and Tsc2−/−, p53−/− MEFs exposed to O, SO, and SOG conditions for 18 h (P < 0.001) (see also Supplemental Fig. S2A,B). (C) Tsc2−/−, p53−/− MEF cell death under SO conditions is rescued by 100 μM Z-VAD-FMK, which inhibits caspases (P < 0.001). (D) Tsc2+/+, p53−/− and Tsc2−/−, p53−/− MEFs were depleted of ARNT protein by treatment with lentivirus expressing shRNAs (see also Supplemental Fig. 2SC). Cells were cultured under SO conditions for 48 h, and viability was evaluated by flow cytometry (P < 0.001). (E) Tsc2+/+, p53−/− and Tsc2−/−, p53−/− MEFs were depleted of HIF-1α protein by treatment with lentivirus expressing shRNAs (P < 0.005) (see also Supplemental Fig. 2SD). Cells were cultured under SO conditions for 48 h, and viability was evaluated by flow cytometry. (F) To determine whether cycloheximide rescues cell death under SO limitation, Tsc2+/+, p53−/− and Tsc2−/−, p53−/− MEFs were exposed to SO conditions with or without 1 μM cycloheximide, and cell viability was assayed (P < 0.001). (G) Representative electron micrographs illustrate the differences in ER morphology between Tsc2+/+, p53−/− and Tsc2−/−, p53−/− MEFs cultured under SO limitation. White arrows highlight the ER, while black arrows indicate autophagosomes (see also Supplemental Fig. S2E). (H) We compared the viability of Tsc2−/−, p53−/− MEFs exposed to 10% FBS or 10% lipid depleted FBS Ored (P < 0.001) ( see also Supplemental Fig. S2F).

