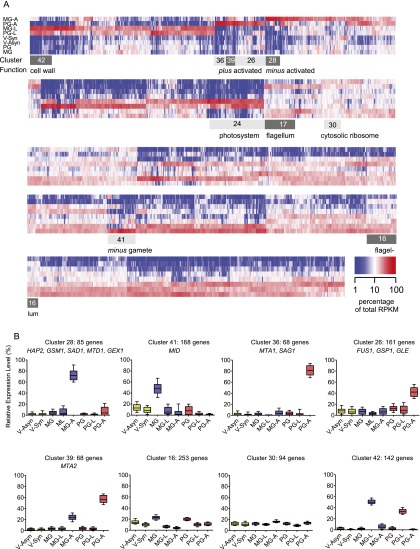
Figure 2.
Cluster analysis of gene expression patterns in C. reinhardtii. (A) Heat map showing the relative abundance of 10,738 putative transcripts across eight treatment groups as a percentage of total RPKM for each transcript. Transcripts were clustered along the X-axis according to Ward. The light-gray and dark-gray boxes indicate the borders of selected clusters. (B) Relative expression patterns in selected clusters. Boxes show the median and the 25th and 75th percentiles. Whiskers indicate the 10th and 90th percentile. Marker genes with known functions in sexual development are indicated.

