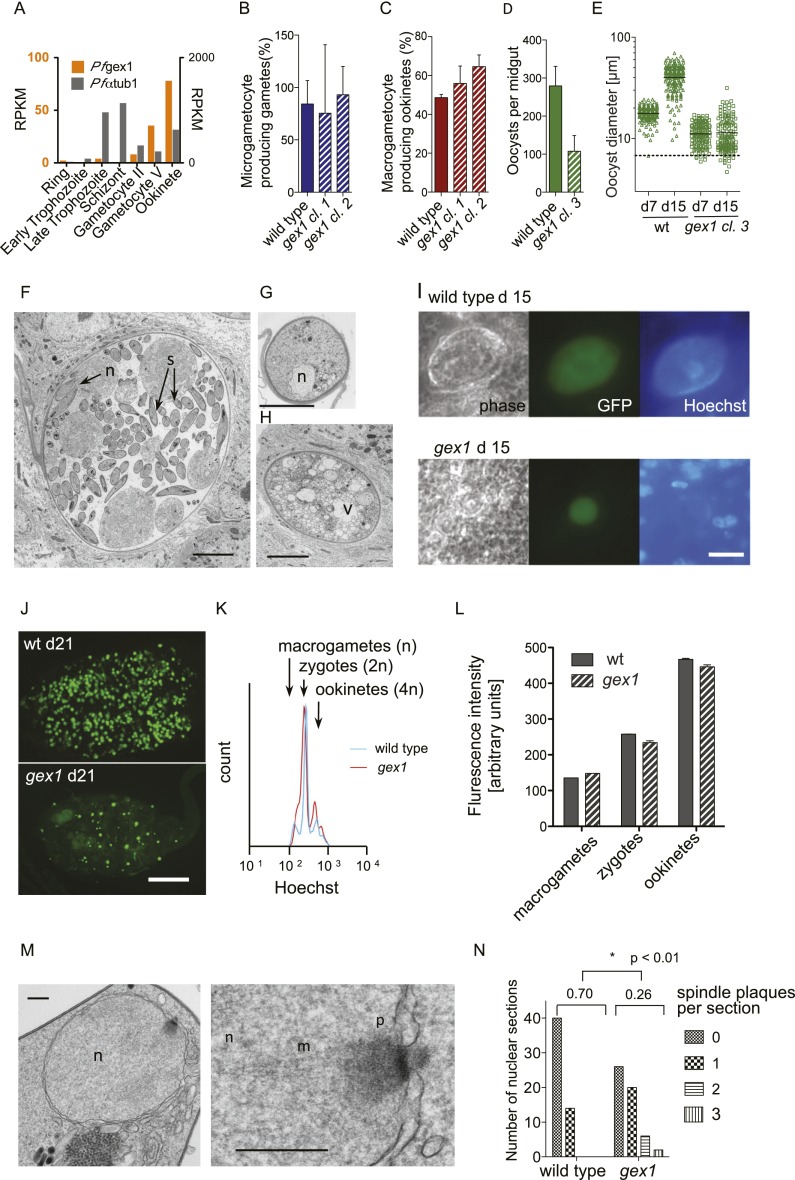
Figure 4.
Phenotypic analysis of gex1 knockout clones in P. berghei. (A) Sexual stage-specific expression profile for P. falciparum gex1 from RNA-seq data by López-Barragán et al. (2011). Expression of α-tubulin 1 (PF3D7_0903700) is shown for comparison. (B) Exflagellating microgametocytes as a percentage of all microgametocytes in blood samples from infected mice. B–D show arithmetic means and standard deviations (SD) from three biological replicates. (C) Macrogametocyte-to-ookinete conversion in blood samples cultured for 24 h. (D) Average oocyst numbers on midguts 7 d after the infectious blood meal. Bars show arithmetic means ± SD of three transmission experiments per strain, each derived from analyzing 20–30 mosquitoes. (E) Size distribution of oocysts. Data from clone 3 are representative of observations with the other clones. (F) TEM of wild-type oocyst showing budding sporozoites (s) on day 15 post-feeding. (F–H) Bar, 5 μm. (G) Typical small gex1 oocyst on day 15. (H) Representative larger gex1 oocyst with vacuolation. (I) Immunofluorescence micrographs of oocysts showing replicated nuclei in the center of the cyst and lined up around its periphery in wild type but not in the gex1 cyst. Hoechst staining outside the oocyst is from nuclei of midgut epithelial cells. Bar, 20 μm. (J) Overview of whole, live infected midguts showing strong GFP fluorescence of oocysts and weak background fluorescence of the midgut tissue. Bar, 0.2 mm. (K) Fluorescence intensity profiles of macrogametocyte-derived stages purified from a representative 24-h ookinete culture and stained with Hoechst 33342. (L) Relative DNA content as determined by Hoechst fluorescence intensity of the different populations indicated in K. Error bars show the SD from three independent cultures and infections. (M) TEM of the nucleus of a 16-h-old wild-type ookinete illustrating an electron-dense spindle plaque (p) and emanating spindle microtubules (m) located in a nuclear pore. Bars, 250 nm. (N) Distribution of spindle plaque numbers in 54 ookinete nuclear sections per strain. Means are given and are significantly different by Student's t-test.

