Figure 2.

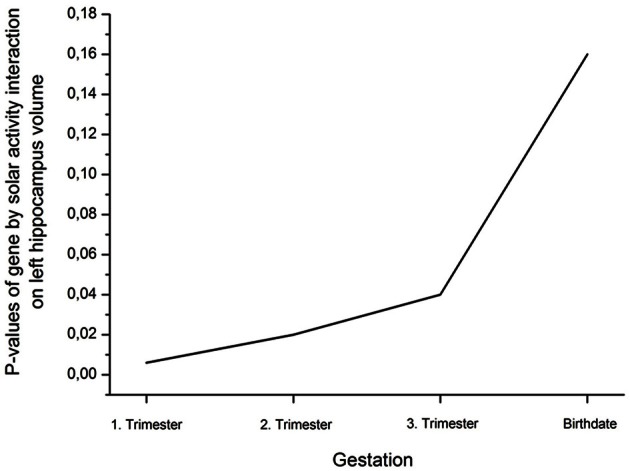
Decline (rise of p-values; η2 are presented in Table 2) of the interaction effect gene by solar activity from the first trimester to birth on left hippocampus volume.

Decline (rise of p-values; η2 are presented in Table 2) of the interaction effect gene by solar activity from the first trimester to birth on left hippocampus volume.