


Figure 4.
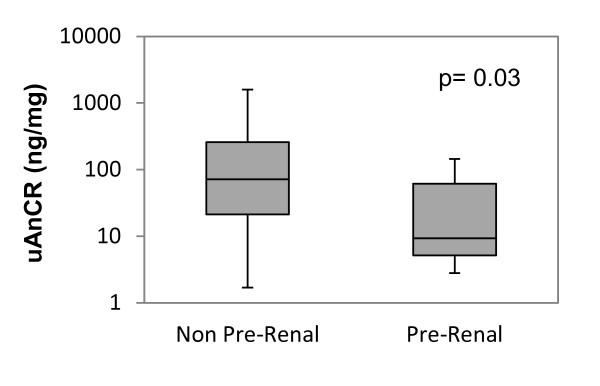
Urinary angiotensinogen-to-creatinine ratio in pre-renal acute kidney injury (AKI) compared to AKI of other etiologies. The box and whiskers plots show the median and interquartile range. Error bars represent the 5th and 95th percentiles. Groups were compared with the Mann-Whitney U-test. UAnCR, angiotensinogen-to-creatinine ratio.