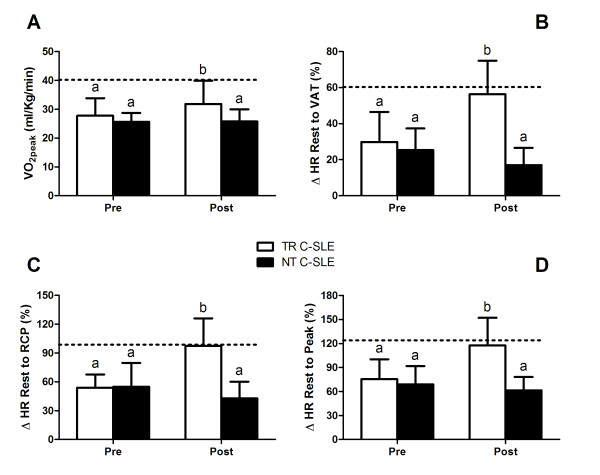
Figure 3.
Cardiorespiratory measurements before (PRE) and after (POST) the exercise training. Dotted lines represent mean data from the healthy control group at baseline. (A) Peak oxygen consumption (VO2 peak). (B) Relative change in heart rate (Δ%) between rest and the ventilatory anaerobic threshold (VAT). (C) Relative change in heart rate (Δ%) between rest and the respiratory compensation point (RCP). (D) Relative change in heart rate (Δ%) between rest and peak exercise (Peak). TR C-SLE, trained patients with childhood-onset systemic lupus erythematosus; NT C-SLE, non-trained patients with childhood-onset systemic lupus erythematosus. Means with different letters are significantly different from each other: a, significant difference when compared with the healthy control group; b, no significant difference when compared with the healthy control group.

