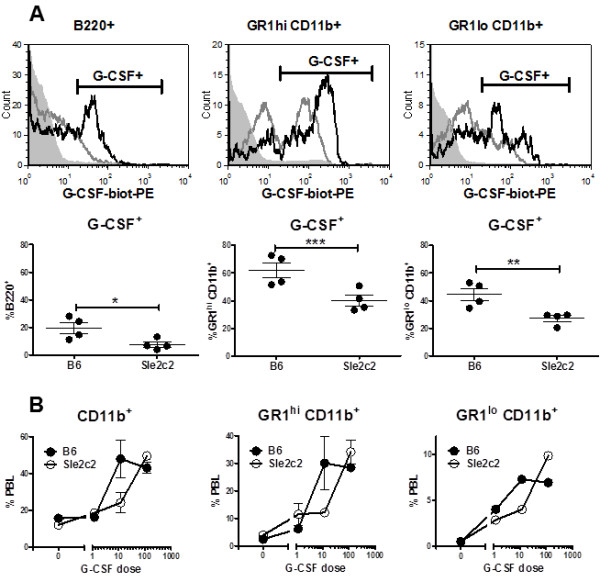
Figure 1.

Differential response of B6.Sle2c2 and B6 leukocytes to granulocyte-colony stimulation factor (G-CSF). (A) Mouse (m)G-CSF binding by B6 and B6.Sle2c2 leukocytes measured with biotinylated G-CSF and steptavidin-PE (G-CSF-biot-PE). The top row shows representative overlays of the B6 (black) and Sle2c2 (gray) histograms, with the gray-filled histograms showing the controls without added mG-CSF for the indicated gated cell populations. (B) Total CD11b+, GR1hi CD11b+ and GR1lo CD11b+ peripheral blood leukocytes (PBLs) in untreated B6 and B6.Sle2c2 mice (n = 6 per strain), and 4 d after injections of 1.2, 12.0 or 120.0 ug human (hu)G-CSF (n = 2 per dose per strain). The graphs show mean and standard error of the mean with the significance value from the t-test (*P < 0.05; **P < 0.01; ***P < 0.001).
