
Figure 1.
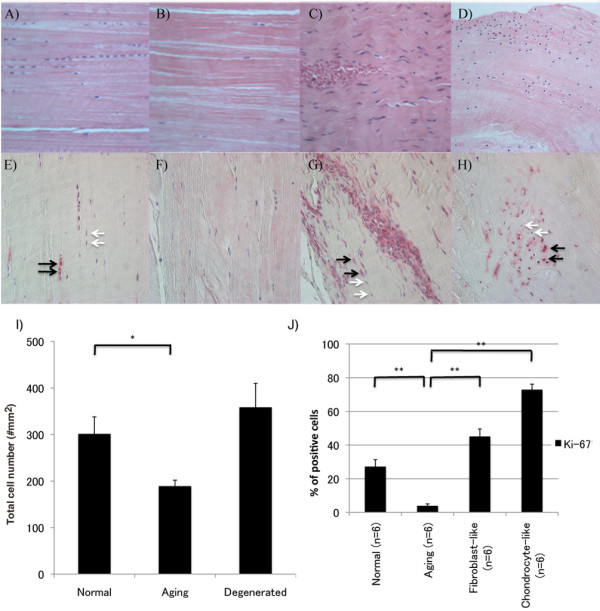
Cell organization, cell density, and Ki-67 expression in ACL. (A-D) H&E staining; (E-H) Ki-67 (original magnification ×40). Sections of ACL representing (A, E) normal cell distribution in ACL from young normal knee; (B, F) hypocellular ACL from aging knee; (C, G) fibroblast-like cell aggregates in degenerated ACL; (D, H) chondrocyte-like cell aggregates in degenerated ACL. Black arrows, Ki-67-positive cells; white arrows, Ki-67-negative cells. The graph (I) represents the total cell density in each ACL group. The graph (J) represents the percentage of Ki-67-positive cells. The results are presented as mean ± SEM. *P < 0.05; **P < 0.01.