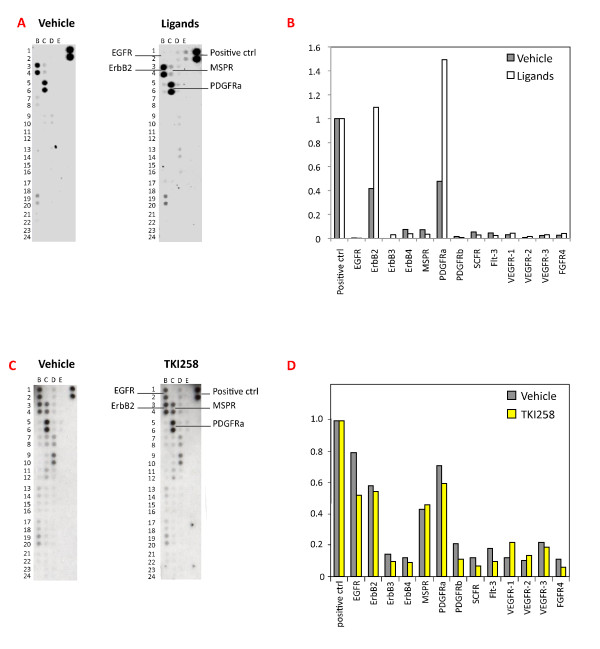
Figure 4.
Anti-phosphotyrosine receptor antibody (P-Tyr RTK) array analysis of 4T1 cells and tumors. (A-B) P-RTK analysis on lysates of 4T1 cultures either growing in low serum (Vehicle) or stimulated for 15 minutes with 20 ng/ml EGF, 12 nM HRG or 20 ng/ml platelet-derived growth factor (PDGF) (Ligands). Lysates from individual ligand-treated cells were pooled prior to analysis. (B) Quantification of the signal intensity of the indicated p-RTKs is shown in comparison to positive control, set as 1. (C-D) Three control (Vehicle) and 50 mg/kg dovitinib-treated (TKI258) 4T1 tumors were harvested after 3 days treatment, and lysates were pooled and analyzed on P-RTK filters. (D) Quantification of the intensity of signal of indicated p-RTKs is shown, in comparison to positive control set as 1.

