
Figure 2. Patients showed decreased brain activation relative to healthy controls for the main effect of the visuomotor tracking task at baseline.
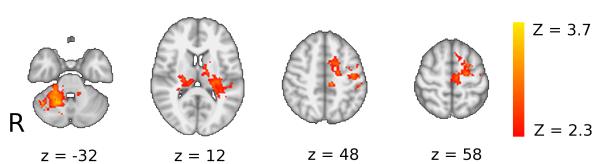
Brain regions in which controls have greater activation than patients during performance of the visuomotor tracking task at baseline. Axial slices are shown for MNI z-coordinates provided in the figure. The activation changes are illustrated with a cluster forming threshold of Z>2.3, and a corrected cluster extent threshold of p<0.05 and are superimposed on a background MNI template brain image with the left hand side of the brain (ipsilesional in patients) displayed on the right hand side of each brain slice. See Table 2 for details of local maxima.