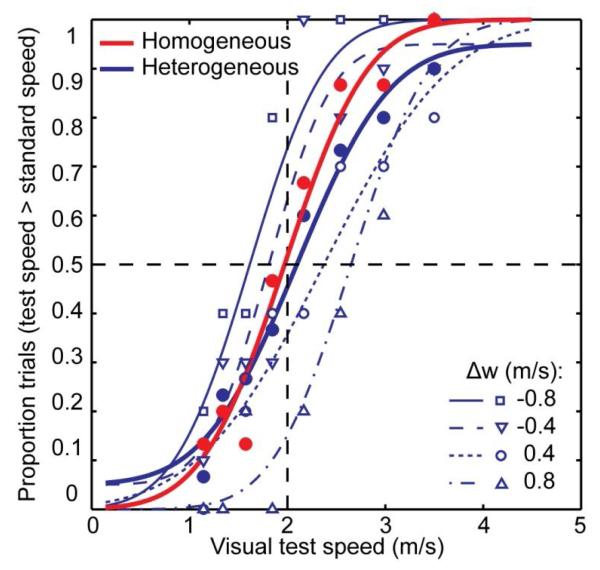
Figure 2.
Example psychometric functions for one participant. Small open symbols show the proportion of trials in which the test speed was reported to be faster than the standard speed (2 m/s in this example), separately for the different changes in walking speed between the two intervals (Δw = wt - ws). Thin lines represent the best fitting cumulative Gaussians to these data. Filled symbols and fat lines represent the aggregated data (across walking speed differences) in the heterogeneous (blue) and in the homogeneous (red) conditions, and the best fitting cumulative Gaussians, respectively. PSEs were determined as the test speed which corresponds to the 50% point on the curve. The discrimination threshold was estimated as the point on the curve that produced a 34% performance difference with the PSE.

