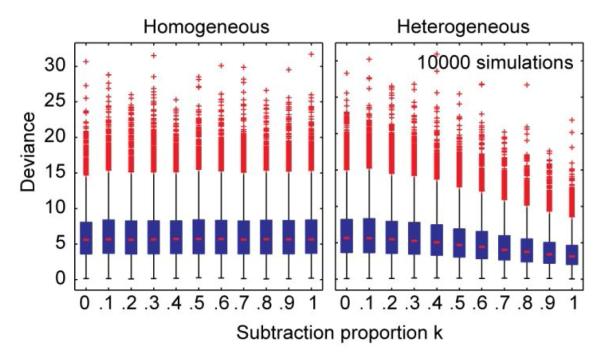
Figure A3.
Boxplots of the deviance of data from fitted psychometric curves in homogeneous (left) and heterogeneous (right) trials, as a function of subtraction proportion k. Each boxplot shows the deviance distribution from 10000 simulations. Boxplots as in Figure A2.

