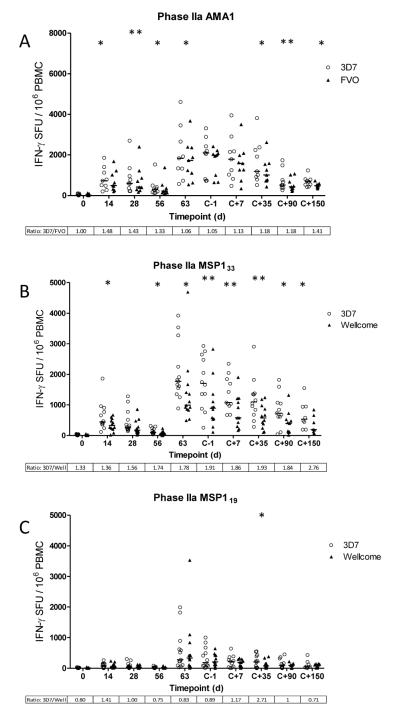
Figure 2.
Comparison of allele specific IFN-γ T cell responses to 3D7 (open circles) and FVO/Wellcome (closed triangles) AMA1 and MSP1 in volunteers at key time points during a Phase IIa clinical trial of bi-allelic AMA1 and MSP1 vaccines. Volunteers underwent CHMI ~16 days post boosting vaccination. Graphs represent the individual response and group median for T cell responses, expressed as IFN-γ SFU/106 PBMC summed from pools containing overlapping peptides from the vaccine insert. (A) AMA1 allele specific responses calculated by adding the allele specific response (3D7 or FVO) to the common pool response for each individual. MSP133 (B) and MSP119 (C) fragment specific responses for each allele (3D7 or Wellcome) calculated by adding responses from representative pools. Day 0 calculations are excluded from statistical analysis. Ratios for the two median response are also included (>1 = stronger 3D7 response). *P = <0.05, **P = <0.01.

