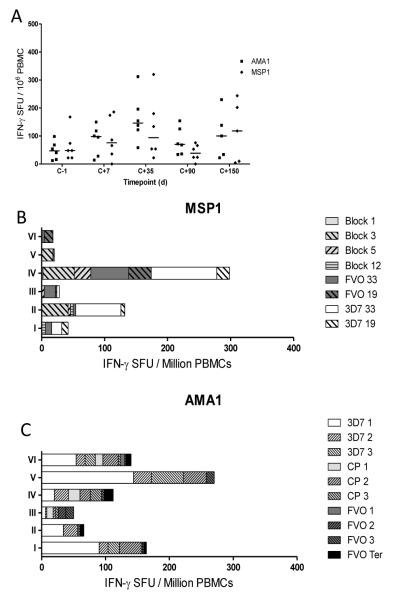
Figure 3.
CHMI induces allele-specific responses in unvaccinated control volunteers in a Phase IIa efficacy study. (A) The total antigen specific IFN-γ T cell response peaks 35 days post CHMI (dC+35). Peak response breakdown to individual pools for MSP1 (B) and AMA1 (C) following 3D7 challenge, calculated by subtracting baseline response before CHMI (dC-1) from response 35 days after CHMI (dC+35). Pools can be identified as containing conserved sequences (light grey), 3D7-specific sequences (white), Wellcome/FVO-specific sequences (dark grey), or FVO AMA1 C-terminal region sequences (black).

