
Figure 4.
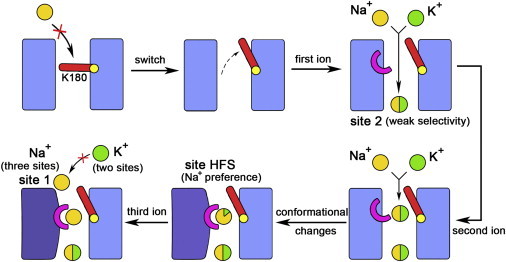
Schematic representation for the mechanism of the mammalian Nav channels. Na+ and K+ ions are represented by yellow and green spheres, respectively, and the ion selectivity is reflected by the ratio of yellow and green colors in one sphere. Lys and Asp/Glu are represented by the red bar and the pink half ring, respectively. The conformational changes are indicated by changes in both the color and the shape of the rectangles, which represent the pore domain.