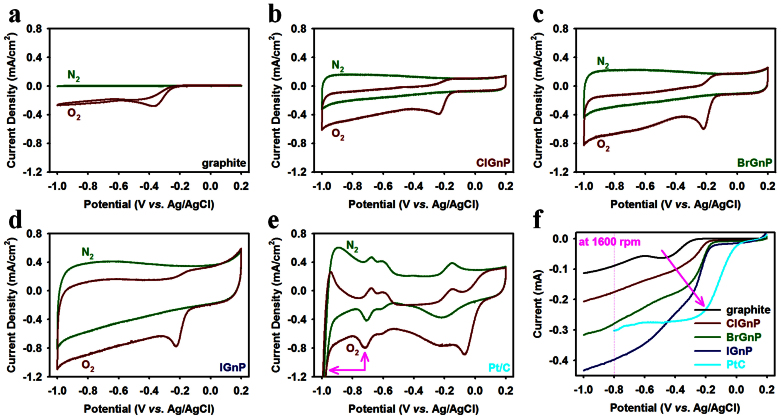
Figure 3. Cyclic voltammograms (CV) of samples on glassy carbon (GC) electrodes in N2- and O2-saturated 0.1 M aq. KOH solution with a scan rate of 10 mV s−1.
(a) the pristine graphite; (b) ClGnP; (c) BrGnP; (d) IGnP; (e) Pt/C. Pink arrows indicate the contributions of hydrogen evolution at around −0.7 V and out of limiting potential (−0.8 V). (f) Linear sweep voltammograms (LSV) at a rotation rate of 1600 rpm and a scan rate of 10 mV s−1, showing a gradual increase in current and a positive shift in the onset potential along the order of the pristine graphite < ClGnP < BrGnP < IGnP < Pt/C (pink arrow).

