
Figure 2.
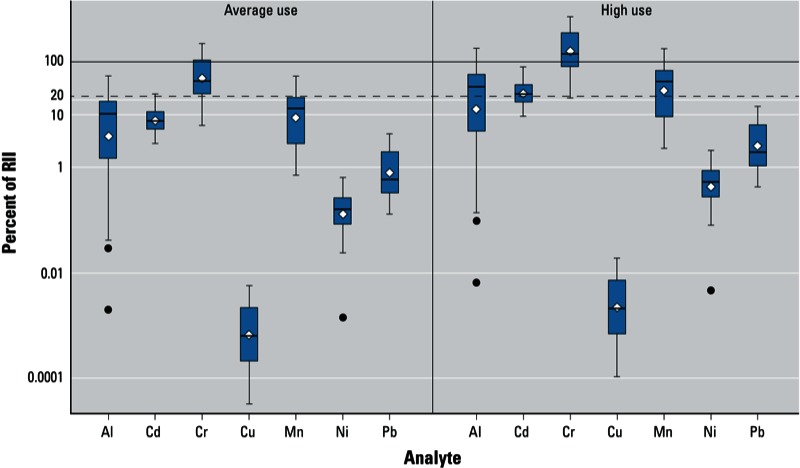
Box and whiskers plots showing distributions of RII values for each metal assuming average use or high use of lip products, defined as 24 and 87 mg of product/day, respectively. Corresponding numeric data are provided in Table 3 for all samples (n = 32). Boxes extend from the 25th to the 75th percentile, horizontal bars inside the boxes represent the median, diamonds represent the mean, whiskers extend to maximum and minimum observations within 1.5 times the length of the interquartile range above and below the 75th and 25th percentiles, respectively, and outliers are represented as circles. RII values represent the estimated daily intake for each metal as a percentage of the ADI values derived for this study. The horizontal line at RII = 100 indicates daily intakes that are equal to the ADI values for each metal; the horizontal line at RII = 20 indicates estimated daily intakes that are 20% of the ADI.