
Figure 1.
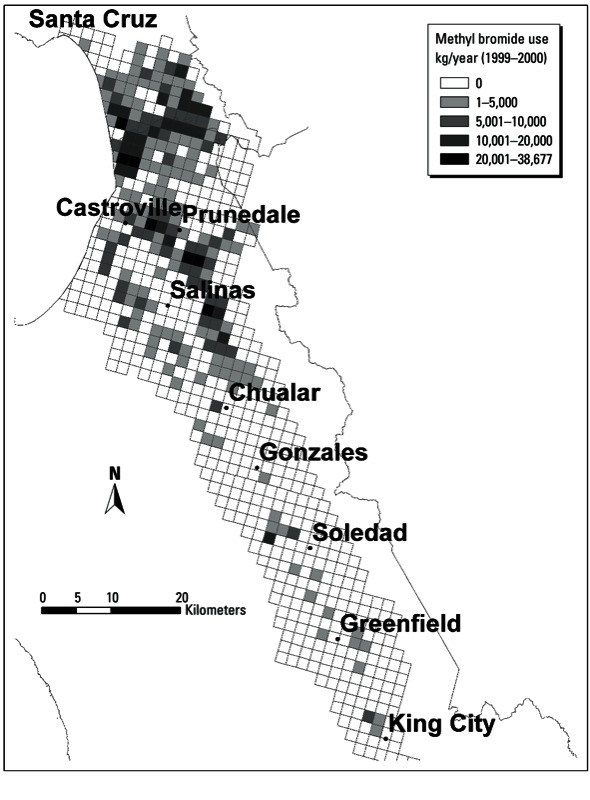
Distribution of methyl bromide use (kg/year) from the California PUR system by section of the PLSS grid in the Salinas Valley, 1999–2000. Data source: California Department of Pesticide Regulation (2012b).
Official websites use .gov
A
.gov website belongs to an official
government organization in the United States.
Secure .gov websites use HTTPS
A lock (
) or https:// means you've safely
connected to the .gov website. Share sensitive
information only on official, secure websites.
Distribution of methyl bromide use (kg/year) from the California PUR system by section of the PLSS grid in the Salinas Valley, 1999–2000. Data source: California Department of Pesticide Regulation (2012b).