
Figure 1.
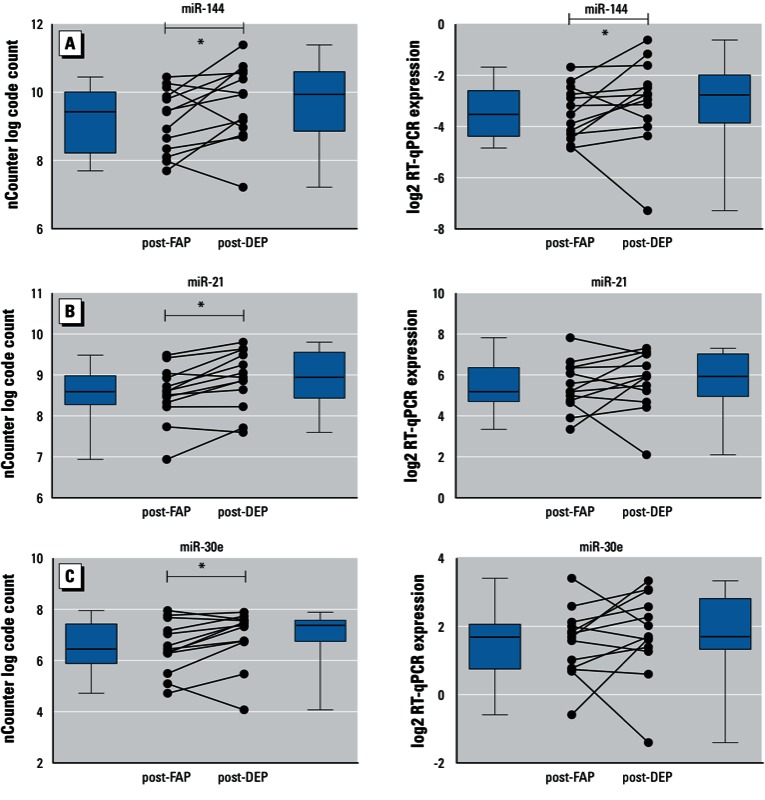
The normalized nCounter data (left panels) and the expression levels measured with RT-qPCR (right panels) of miR-144 (A), miR-21 (B), and miR-30e (C) are shown. Dot plots show 13 individual participants’ data, boxes delineate first and third quartile, whiskers represent minima and maxima respectively, solid lines within boxes indicate medians. *FDR < 0.05.