Figure 1.

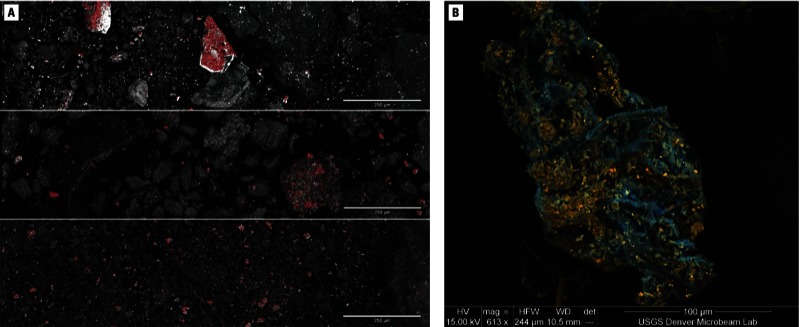
(A) Backscatter electron (BSE) scanning electron microscope (SEM) images of Nigeria ground ore (upper), eating area sweep (middle), and soil (lower) samples with overlain element maps for lead (in red). In all images, the brighter gray indicates higher mean atomic number. Bar = 250 µm. (B) BSE field emission SEM image of a cluster of plant fibers and mineral particles found in a grain sample (ground by a flour mill in Zamfara) having 3 ppm total lead. Elongated plant fibers are light to dark blue. Bright orange particles are lead carbonates, lead oxides, and lead phosphates. Pale orange/blue particles containing iron, chromium, and nickel are steel particles abraded from flourmill grinding plates. The cluster formed during grinding, with the fiber bundle attracting and trapping the mineral and metal fragments. Bar = 100 µm.
