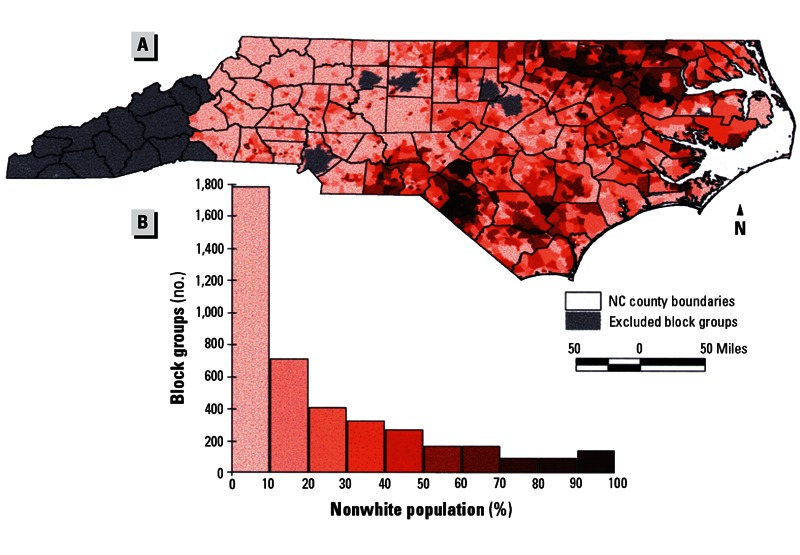
Maps from an older study show distributions of poverty, minority residents, and hog CAFOs in North Carolina as of 1998–2000. Little has changed appreciably since then.
Source: Wing et al. (2000)20

Maps from an older study show distributions of poverty, minority residents, and hog CAFOs in North Carolina as of 1998–2000. Little has changed appreciably since then.
Source: Wing et al. (2000)20