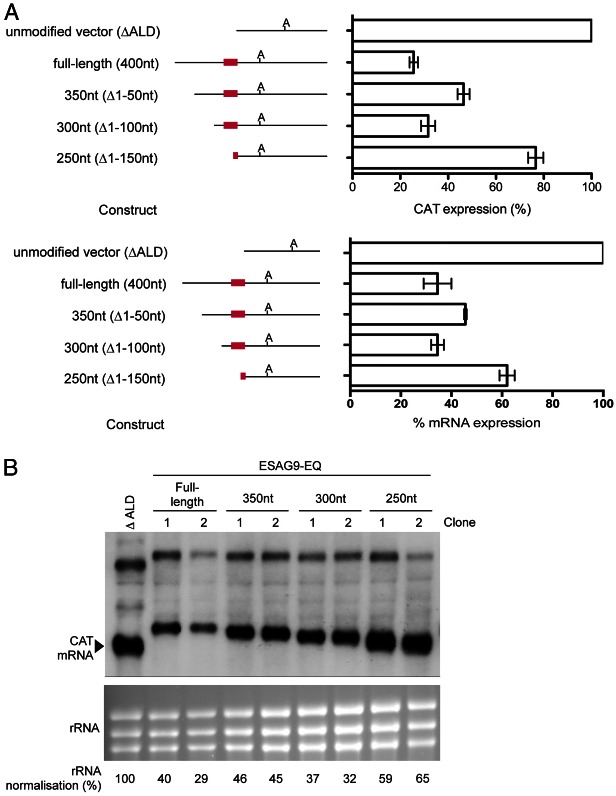
Fig. 2.
Deletion analysis of regulatory regions in the ESAG9-EQ 3′UTR. (A). CAT protein (upper panel) and mRNA (lower panel) expression from the constructs shown, as a percentage of expression from one clone of the ΔALD 3′UTR control. The number of biological replicates (independently derived clones) used was: full-length: 5, 350 nt: 2, 300 nt: 3, 250 nt: 3; each with 1–2 experimental replicates. Values are means ± standard error of the mean (s.e.m.) of biological replicates for the protein expression, and means ± the lower and upper values from two replicates is shown for mRNA expression, these being derived from B). At the left of the graphs are schematic representations of the sequence analysed in each construct, where ‘A’ indicates the polyadenylation site location and the red line indicates the regulatory element location. (B) Northern blot analysis of CAT mRNA, with RNA from the ΔALD vector and two biological replicates of each of the full-length, 350 nt, 300 nt and 250 nt constructs. The lower panel shows the ethidium bromide staining of the rRNA present in each sample, analysed to indicate the loading of each lane. Below the lower blot are values of CAT mRNA abundance following normalisation to rRNA as a percentage of that obtained for the unmodified vector. The upper bands in all lanes represent a bicistronic transcript always detected using this construct (e.g. Mayho et al., 2006).

