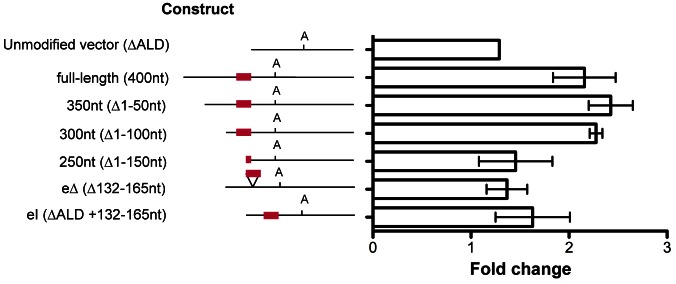
Fig. 5.

Response of CAT reporter gene expression to 8-pCPT-2′-O-Me-cAMP treatment for ESAG9-EQ 3′UTR-based constructs. Fold change in CAT protein expression levels between cells treated with 10 µM 8-pCPT-2′-O-Me-cAMP and control cells are shown. Values are means ± s.e.m. of biological replicates; unmodified vector, n = 1; full-length and eΔ, n = 3; other constructs, n = 2. For each cell line there were two experimental replicates, meaning that the CAT ELISA assays were performed with samples taken from two separate 8-pCPT-2′-O-Me-cAMP treatment experiments, except for the unmodified vector clone, which had one biological replicate and five experimental replicates, this line being included in each 8-pCPT-2′-O-Me-cAMP treatment experiment as a control. At the left of the graph are schematic representations of the sequence analysed in each construct, with the polyadenylation site location indicated with ‘A’ and the regulatory element location indicated by the red line.
