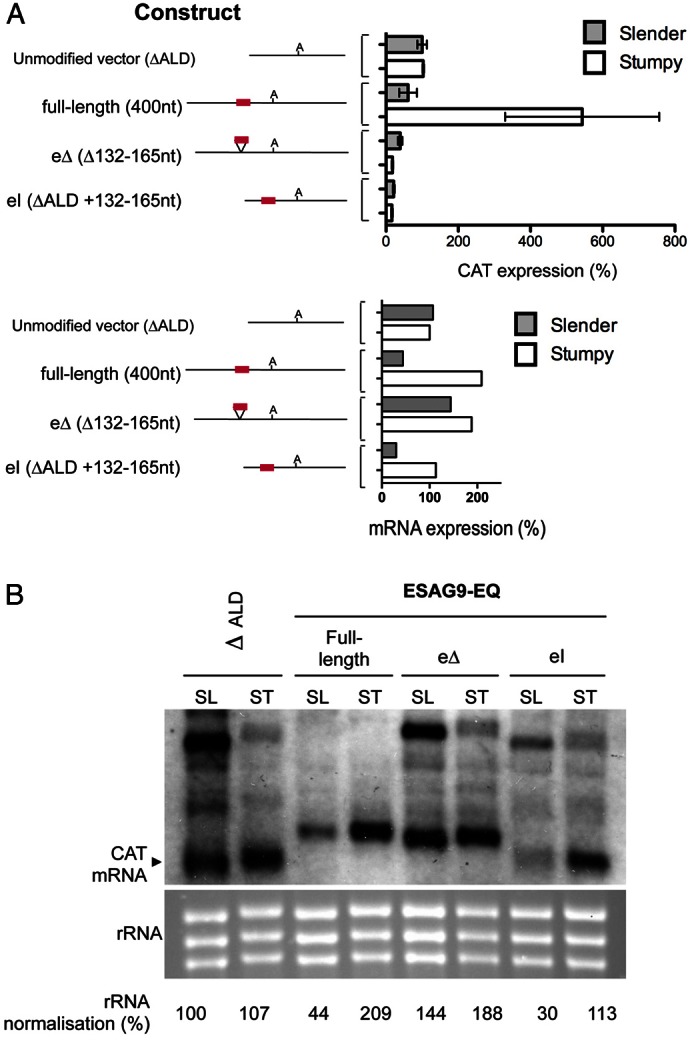
Fig. 6.

Analysis of the ESAG9-EQ 3′UTR and associated element in true slender and stumpy forms using a CAT reporter gene assay. (A) CAT protein expression (upper panel) and mRNA expression (lower panel) from the constructs in slender form (grey bars) and stumpy form (white bars) cells, shown as a percentage of expression from cell lines of the unmodified vector slender form cells. For protein data, values are the means ± s.e.m. of two biological replicates (cell lines) for each construct. Therefore, because n = 2 for each, the standard error bars represent the data range. To the left of the graph are schematic representations of the sequence analysed in each construct, with the polyadenylation site location indicated with ‘A’ and regulatory element location indicated by the red line. mRNA values are derived by quantification of the signal from the blot shown in B. (B) Northern blot analysis of CAT mRNA, with RNA from the ΔALD vector, full-length ESAG9-EQ 3′UTR, element deletion (eΔ) and element insertion (eI) constructs in slender (SL) and stumpy (ST) forms. Shown in the lower panel is the ethidium bromide staining of the rRNA present, to indicate the loading of each lane.
