
Fig. 4.
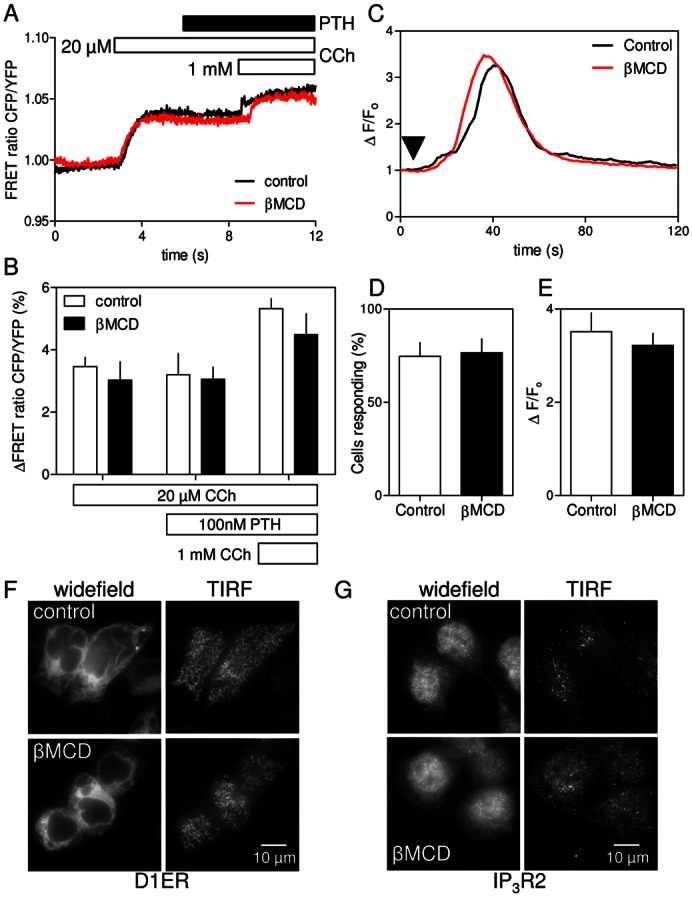
Cholesterol depletion has no effect on IP3 formation, IP3 receptor sensitivity or ER morphology. (A) Normalized changes in the CFP/YFP FRET ratio of an IP3 sensor (see Materials and Methods and supplementary material Fig. S4) in HEK-PR1 cells stimulated with CCh (20 µM), then PTH (100 nM) and finally a maximal concentration of CCh (1 mM). Traces show changes in FRET ratio for single cells, each representative of six experiments, with or without βMCD treatment. (B) Summary (means ± s.e.m.) shows cumulative changes in FRET ratio for 15 control cells and 11 βMCD-treated cells from six independent experiments. (C) Ca2+ release evoked by photolysis of ciIP3 (arrow) in HEK-PR1 cells with and without pre-treatment with βMCD (2% w/v, 20°C). Each trace shows the average change in fluorescence (ΔF/F0) for ≥20 cells from a single field. Examples of responses from individual cells are shown in supplementary material Fig. S5. (D,E) Summary of results shows the fraction of cells responding to iIP3 (D) and average amplitude (ΔF/F0) of the Ca2+ transient in cells that responded (E). Results are means ± s.e.m. for n≥3 coverslips, with 5 fields per coverslip (∼150 cells/coverslip). (F,G) Distribution of the ER marker, D1ER (F) and IP3R2 (G) in control and βMCD-treated HEK-PR1cells. Images show the distributions in widefield and in the region immediately beneath the plasma membrane using TIRFM. Images are representative of at least three experiments. Supplementary material Fig. S6 shows similar analyses of IP3R1 and IP3R3.