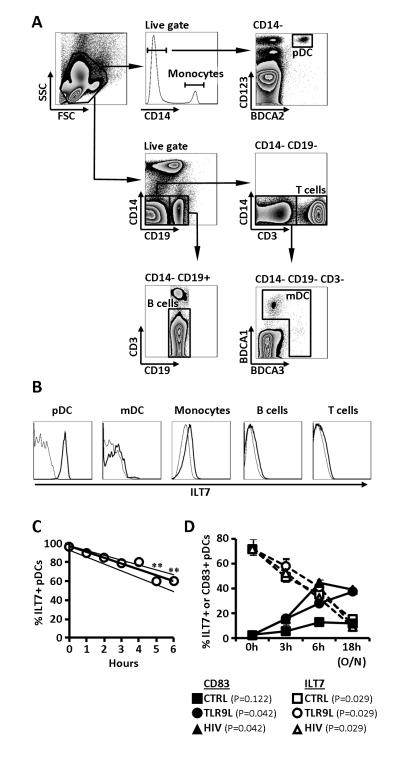
Figure 1. ILT7 expression is limited to pDCs and is downregulated following in vitro culture.
A) Flow cytometry dot-plots showing the gating strategy used to identify pDC (CD14− BDCA2+ CD123+), monocytes (CD14+), mDC (CD19− CD14− CD3− BDCA1/BDCA3+), B cells (CD14− CD3− CD19+) and T cells (CD14− CD19− CD3+). B) Flow cytometry histograms showing ILT7 expression on different cell populations gated as in panel A; thin lines indicated fluorescence minus one (FMO) controls and thick lines indicate ILT7 staining; for both panels A and B one example of experiments performed on N=6 independent donors is shown. C) Frequency of ILT7+ pDCs in function of time; each dot represents median of N=5 donors for a specific time point; lines indicate linear regressions of medians and IQRs; ** P<0.01 compared to 0 hours (Friedman’s test with Dunn’s correction for multiple pairwise comparisons). D) Change in the frequency of ILT7+ pDCs (circles) and CD83+ pDCs (triangles) overtime in presence or absence of the TLR9L CpG ODN or HIV; medians and IQRs are shown (N=3); P values in legend indicate Friedman’s test results for changes overtime in each condition.

