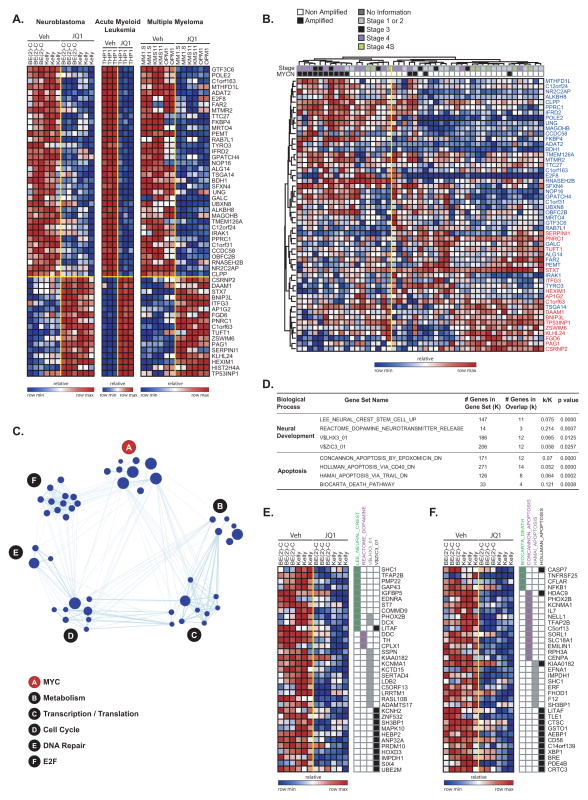
Figure 4.
Transcriptional changes associated with BET bromodomain inhibition by JQ1. (A) Heatmap of the 36 down- and 17 up-regulated genes after JQ1 treatment with a consistent direction of regulation in neuroblastoma, multiple myeloma, and AML and fold-change greater than two and P ≤ 0.05. Data are presented row normalized. (B) Heatmap of the JQ1 consensus signature developed in Fig 4A evaluated in a data set profiling genome-wide expression of primary neuroblastoma tumors. JQ1 consensus signature genes denoted in blue are downregulated and those in red are upregulated with JQ1 treatment. Data are presented row normalized. The neuroblastoma samples cluster into two groups which are associated with the MYCN amplification status of the tumors (P < 0.002 by Fisher exact test) and with high stage (stage 3 and 4) versus low stage (all other) (P < 0.002 by Fisher exact test). (C) A relaxed consensus JQ1 downregulation signature was identified based on the absolute FC ≥ 1.5 and P-value and FDR ≤ 0.05 and was interrogated in a Functional Enrichment Analysis across the MSigDB. The results were visualized with the Enrichment Map software which organizes the significant gene sets into a network called an “enrichment map.” In the enrichment map the nodes correspond to gene sets and the edges reflect significant overlap between the nodes according to a Fisher test. The hubs correspond to collections of genes sets with a unifying class label according to GO biological processes. The size of the nodes is correlated with the number of genes in the gene set. (D) Table describing the results of Fisher tests for the MSigDB signatures enriched with genes selectively downregulated by JQ1 in neuroblastoma cells. Heatmap of the genes uniquely regulated by JQ1 in neuroblastoma in the neural development (E) and apoptosis-related (F) gene sets. Data are presented row normalized.

