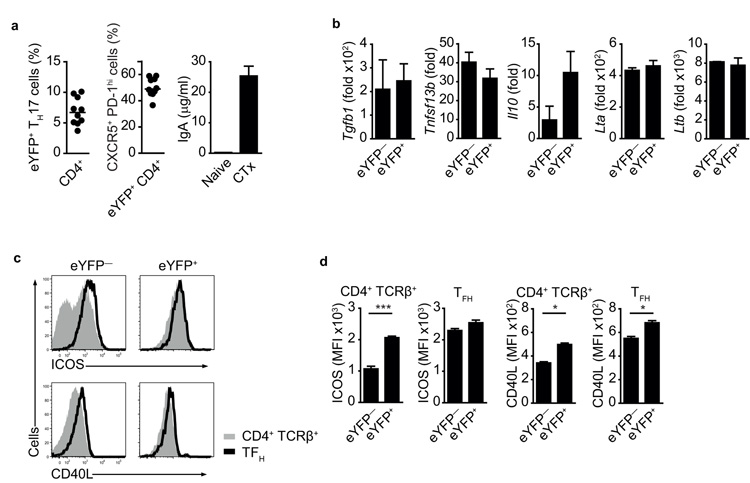
Fig.6. Cholera toxin specific IgA response in Il17aCre R26ReYFP mice.
a) Proportion of eYFP+ cells in PP CD4+ T cells (left panel), proportion of CXCR5+ PD-1high cells in eYFP+ CD4+ T cells (middle panel) and ELISA quantification of cholera toxin-specific IgA (right panel) in cholera toxin-immunized Il17aCreR26ReYFP mice 7-10 days after challenge. b) Quantitative PCR analysis for expression of indicated mRNA in FACS purified eYFP+ and eYFP− CD4+ T cells from PP of cholera toxin-immunized Il17aCreR26ReYFP mice 10 days after challenge. mRNA expression is relative to Hprt. Data in a and b are representative of three independent experiments. c) Flow cytometry of eYFP+ or eYFP− CD4+ TCRβ+ T (shaded line) and TFH (solid line) cells from PP of cholera toxin-immunized Il17aCreR26ReYFP mice 10 days after challenge. d) MFI values of cell types as in c). Mean values +/− SEM are shown for three individual mice. *, p-value < 0.05; **, p-value < 0.005.

