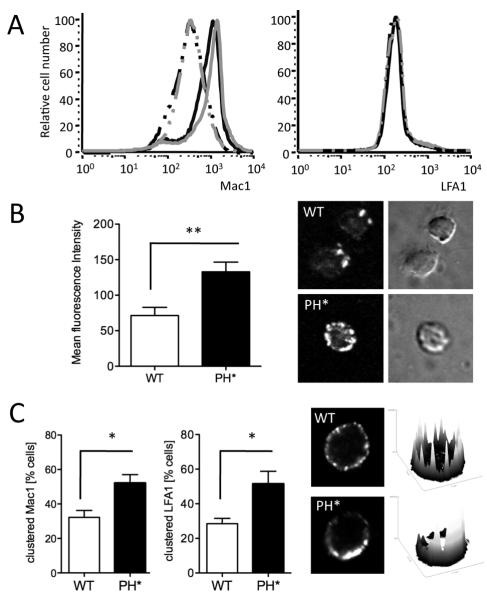
Figure 3. β2 integrins on Arap3PH*/PH*neutrophils have higher affinity and avidity.
(A) Wild-type control and Arap3PH*/PH* bone marrow cells were or were not pre-incubated with 20ng/ml TNFα at 37°C before being labelled with PE-conjugated anti GR1, APC-conjugated anti Mac1 and FITC-conjugated anti LFA1. For FACS analysis, GR1-positive cells were gated and Mac1 and LFA1 staining was measured. Results were analysed with FlowJo V6.4.7 software. Cells from 15 knock-in and 11 control chimeras obtained from three separate reconstitutions were analysed in three experiments.
Representative traces are shown. black lines, wild-type; grey lines, Arap3PH*/PH* ; broken lines, no TNFα, full lines, with TNFα. (B) Unstimulated, bone marrow derived control (WT) and Arap3PH*/PH* (PH*) neutrophils were allowed to bind to ICAM1-Fc in solution in the absence of any stimulation. Cells were washed, fixed and bound ICAM1 was stained with a fluorescently conjugated secondary antibody. Washed, stained cells were allowed to settle on electrostatically coated slides and signal strength was measured by quantitative immunofluorescence. Mean fluorescence intensity obtained from 64 knock-in and 50 control cells in three independent experiments is plotted (mean ± SEM) and representative examples are shown. (C) Integrin clustering was analysed in unstimulated control and Arap3PH*/PH* neutrophils in solution. Bone marrow derived neutrophils were prepared and incubated at 37C in the presence of anti LFA1 or anti Mac1, washed, fixed, stained with a fluorescently conjugated secondary antibody and allowed to settle on electrostatically labelled slides. Distribution of fluorescence was assessed by confocal microscopy. Representative examples (stained for LFA1) are shown together with their corresponding heatmaps (obtained by analysis with ImageJ). Pooled results stem from four independent experiments, in each of which 25 cells per genotype were analysed are plotted (mean ± SEM). (B,C). Results obtained were analyed by paired T-tests. * p<0.05; ** p<0.01.

