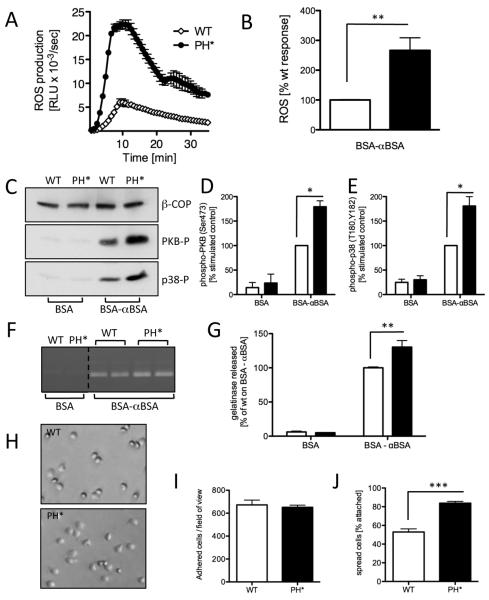
Figure 4. Immune complex-induced events are upregulated in Arap3PH*/PH* neutrophils.
(A,B) Bone marrow-derived Arap3PH*/PH* (PH*) and matched wild-type control (WT) neutrophils were prepared and pre-incubated with luminol as described in materials and methods. 5×10⁵ cells were plated into 96 well plates that had been coated with an immune-complex (BSA anti-BSA). Light emission was measured in a Berthold Microluminat Plus luminometer. Data were recorded in duplicate. Data (means ± range) from a representative experiment are shown in panel A whilst panel B represents accumulated light emissions (means ± SEM) from four independent experiments expressed as a percentage of the responses obtained with wild-type control neutrophils. (C-E) Neutrophils were allowed to adhere to heat inactivated BSA-blocked (BSA) or immune complex-coated (BSA-αBSA) plastic. Lysates were prepared and subjected to immunoblotting with antibodies specific for phospho-PKB (Ser 473) or phospho-p38 (T180, Y182) or β-COP as a loading control. A representative example is shown (C). Blots were quantitated using ImageJ software; integrated data obtained from five independent experiments are shown (D,E). (F,G) Gelatinase granule release was measured by zymography of supernatants of neutrophils that were allowed to adhere to BSA-blocked or immune complex-coated dishes. A representative experiment is shown (F; the samples were not in this order on the original gel and have been pasted next to one another for ease of viewing, this is indicated by a dotted line). Integrated, quantified data obtained from four independent experiments are plotted (G). (H-J) Neutrophils were allowed to adhere to immune complex-coated tissue culture dishes, washed and fixed. Numbers of attached cells (phase dark) per field of view, and the percentage of spread cells (phase light) were counted. Integrated data obtained from three separate experiments are plotted (I,J) and representative examples are shown (H). (All) Raw data were analysed by T-test (Mann Whitney). * p<0.05; ** p<0.01; ***p<0.001.

