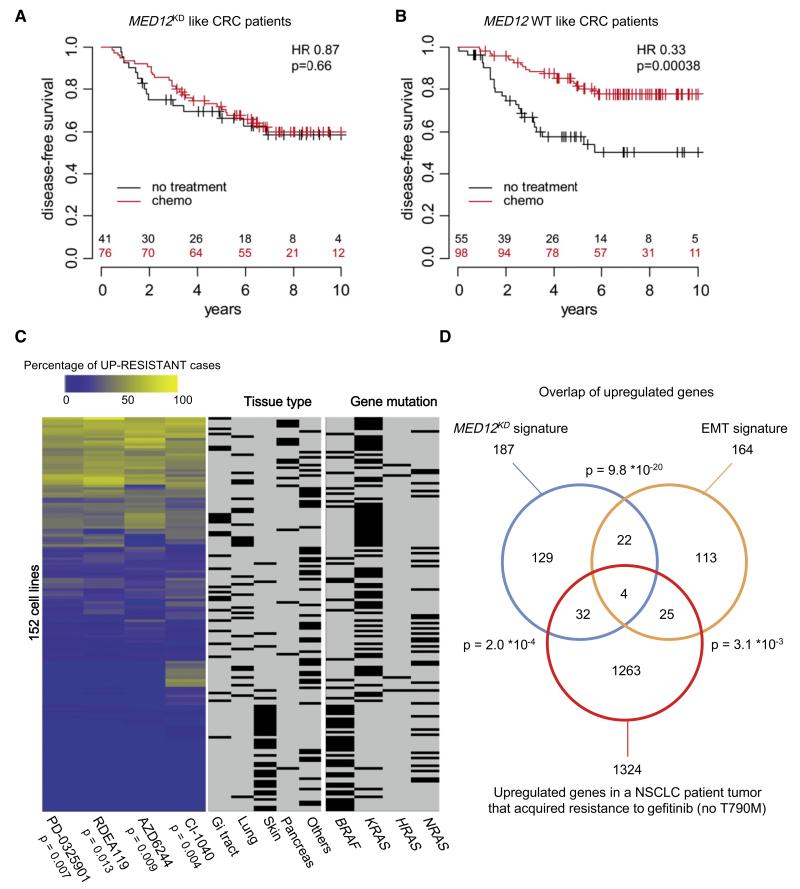
Figure 6. MED12KD Signature Predicts Drug Responses to Cancer Therapies.
(A) Kaplan-Meier (KM) analysis of disease-specific survival (DSS) for the cohort of 117 CRC tumors with MED12KD-like gene signature. Patients with MED12KD-like tumors treated with chemotherapy did not show more significant DSS than untreated patients (red line, chemotherapy; black line, no treatment; HR = 0.87; p = 0.66). See Extended Experimental Procedures for details. HR = hazard ratio; p = p value.
(B) KM analysis of DSS for the cohort of 153 CRC tumors with MED12WT-like gene signature. Patients with MED12WT-like tumors treated with chemotherapy showed more significant DSS than untreated patients (red line, chemotherapy; black line, no treatment; HR = 0.33; p = 0.00038). See Extended Experimental Procedures for details. HR = hazard ratio; p = p value.
(C) MED12KD signature predicts drug responses to MEK inhibitors in 152 cell lines of different cancer types harboring the matching RAS or RAF mutations. High expression of subsets of genes upregulated in the MED12KD signature is significantly associated with higher IC50s for all four MEK inhibitors (AZD6244, p = 0.009; CI-1040, p = 0.004; PD-0325901, p = 0.007; RDEA119, p = 0.013). Across these gene sets, each cell line was scored for the percentage of times it had high expression of the gene as well as resistance to the inhibitor. The heatmap in the left panel of this figure depicts this percentage for each MEK inhibitor. The cell lines are sorted using hierarchical clustering for visualization. The middle and right panel depict the tissue type of the cell lines and their RAS/RAF mutation status.
(D) MED12KD signature genes may be associated with drug resistance to the EGFR inhibitor in NSCLC patients. Genes that are upregulated after acquisition of resistance to gefitinib in a NSCLC patient tumor (not harboring the EGFR T790M gatekeeper mutation) significantly overlap with both the upregulated genes in the MED12KD signature (p = 2.0 × 10⁻⁴) and the genes upregulated during EMT (p = 3.1 × 10⁻³). See Extended Experimental Procedures for details.
See also Figure S7 and Table S2.

