
Figure 2.
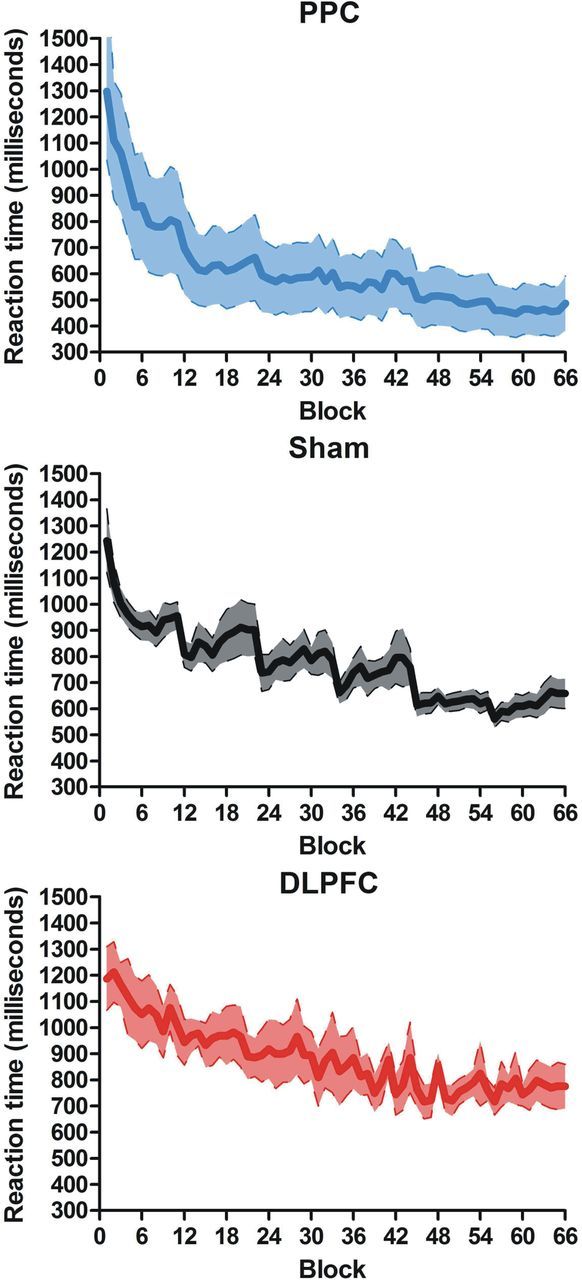
Learning functions for the three groups. Top, PPC group. Middle, Sham group. Bottom, DLPFC group. The slope for the PPC group (top) is steeper than the other two (middle, bottom), indicating faster learning. Analysis of the learning rate gave statistical support to this result by showing a significant difference between the learning rate for each group that was best explained by a linear trend: PPC > sham > DLPFC (p < 0.006); 92% of the variance explained.