
Figure 3. Comparison of inhibition of Vav1 pohosphorylation in the presence or absence of antagonist peptide.
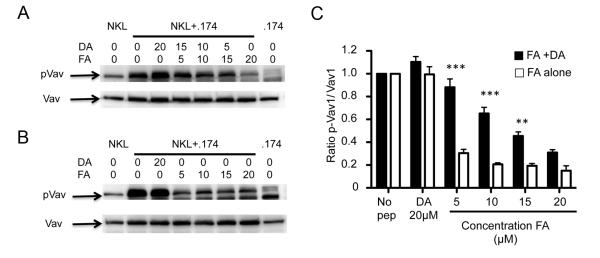
Analysis of cell lysates for Vav1 by western blotting. 721.174 cells were incubated without exogenous peptide, or in the presence of various concentrations of the inhibitory peptide (FA) in the presence (A) or absence (B) of the antagonist peptide DA and the lysates assayed for Vav1 phosphorylation. The peptide concentrations for each condition in μM are indicated. The mean and SEMs of three independent experiments, normalised to Vav1 phosphorylation in the absence of peptide, are shown in (C). For the FA+DA columns, the DA peptide was added to make the total the total peptide concentration 20μM as indicated in panel (A) lanes 2-7, and for the FA alone columns peptide concentrations are as in panel (B) lanes 2-7. Data at each concentration were compared using a one-way ANOVA and a Newman-Keul’s post-test for multiple comparisons. Significantly different levels of Vav1 phosphorylation between FA alone and FA+DA at the same concentrations of the FA peptides are indicated with *** (p<0.001) and ** (p<0.01). Other comparisons were non-significant.