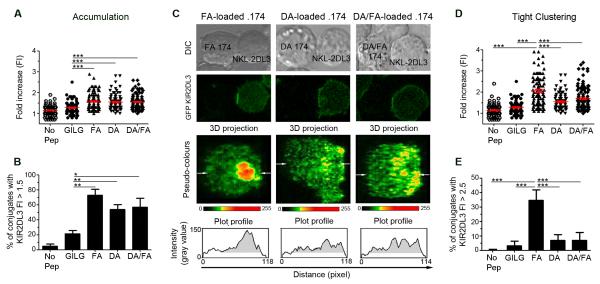
Figure 4. An antagonistic peptide disrupts tight clustering of KIR2DL3 at the inhibitory synapse.
(A-E) Unpulsed 721.221 cells (No Pep) or cells loaded with control peptide (GILG), FA, DA, or both DA and FA (DA/FA) peptides were used as target cells for NKL-2DL3. After a 10 minute co-incubation at 37°C, the conjugates were fixed and imaged by confocal microscopy. (A) The GFP intensity of 86 to 116 conjugates from 3 independent experiments was quantified for each peptide condition. KIR2DL3 accumulation was determined by comparing the intensity at the interface between the effector and target cells, with that of the NKL-2DL3 plasma membrane at a noncontact area and the data plotted as a fold increase in intensity. The mean fold increase in intensity ±SEM is shown in red bars. Data were analysed using one-way ANOVA and Newman-Keul’s post test to compare individual groups. No significant differences were noted between the FA, DA, and DA/FA conditions. (B) Using the same experiments as for (A) the percentage of conjugates showing a KIR2DL3 accumulation with a fold increase ≥ at 1.5 was determined. Data were analysed by Student’s T-test between GILG and other conditions. (C) Confocal microscopy image of 721.174 and NKL-2DL3 conjugates. 721.174 cells were loaded with FA, DA or both peptides at an equimolar ratio (DA/FA). The 3D projection of the interface between NKL-2DL3 and 721.174 is labelled with a pseudo-colour scale and the arrows show the plane used for the plot profile. On the plot profile, the grey area shows the area with a KIR2DL3 accumulation greater than 1.5 times background. (D, E) Analysis of microclusters at the inhibitory synapse. The experiments from (A) were reanalyzed to determine the density of KIR2DL3 accumulation within the area of more than 1.5 times KIR2DL3 accumulation (gray area in (C)). The intensity of KIR2DL3 accumulation area within this region was compared with that of NKL-2DL3 plasma membrane at a noncontact area (D). The means ±SEM are shown in red, and statistical analysis performed as for (A). Significant values for FA versus other conditions are shown. No significant difference was observed between the DA and DA/FA conditions. (E) The percentage of conjugates showing a density of KIR2DL3 accumulation with a fold increase ≥ at 2.5 plotted as mean value ± SEM. FA was compared with the other conditions using a Student’s T-test. For all panels significant p values are indicated as follows: *p <0.05; **p < 0.01; *** p < 0.001.

