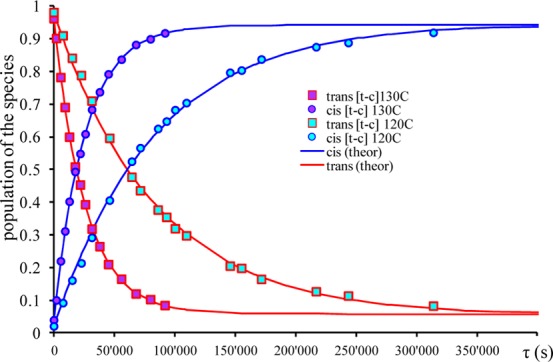
Figure 6.

Time evolution of populations for [cis-OsCl4(NO)(Hind)]− (○) and [trans-OsCl4(NO)(Hind)]− (□) isomers at 120 and 130 °C in C2D2Cl4 for trans to cis [t–c] isomerization processes. The solid lines are the best fits with activation parameters indicated in the text (see also Figure S8 in the Supporting Information).
