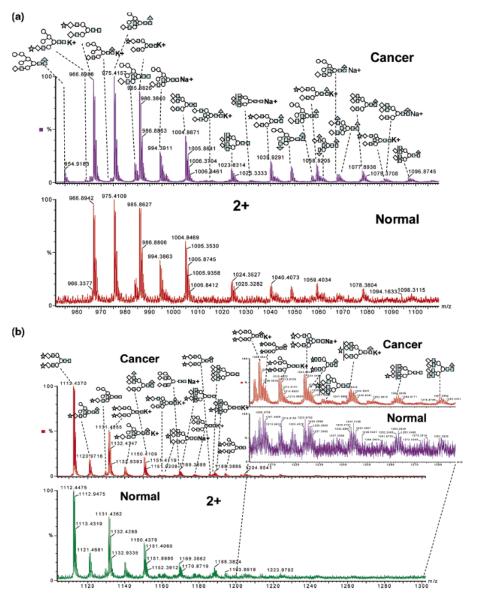
Figure 3.
N-linked carbohydrates were separated by microhydrophilic interaction LC and online detected by ESI-TOF MS. The combined mass spectra of retention time 27–28 min and retention time 28–29 min are shown in (a) and (b). All of the peaks presented here are doubly charged. The spectrum for cancer sample is shown above the normal sample. The zoomed spectrum depicts the differences between cancer and control. Symbols: black triangle, fucose; black star, N-acetyl neuraminic acid (sialic acid); black square, HexNAc; white circle, mannose; white diamond, galactose. Reproduced with permission from [47].

