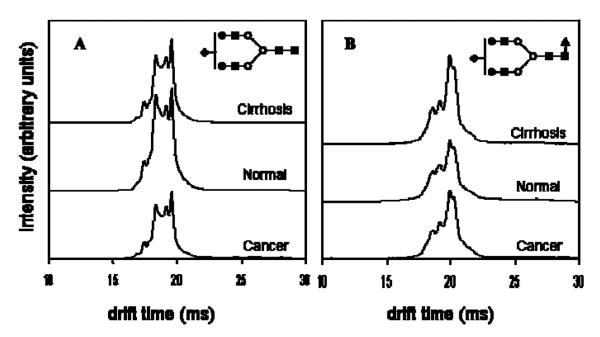
Figure 4.
Average drift time profiles of (A) [S1H5N4+3Na]3+ and (B) [S1F1H5N4+3Na]3+ glycans showing both conformational and intensity differences with respect to disease state. Note that in the case of S1H5N4, the disease states exhibit lower overall intensities than the healthy state, while S1F1H5N4 shows higher overall drift time intensities in the case of diseased states than in the healthy state. This might be due to increased fucosylation of glycans with cancer and cirrhosis. Additionally, for both ions, careful inspection of drift time profiles show variances in intensities of finer features between the three groups. Symbols: as in Figure 3. Reproduced with permission from [51].

