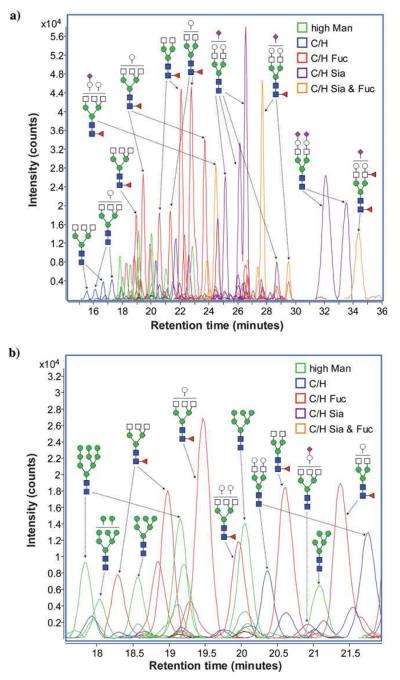
Figure 5.
(a) Extracted compound chromatograms (ECCs) of glycans found in a representative serum sample. (b) Magnified view of a short segment of the glycan elution profile, showing the high sensitivity and resolution achieved by nano-LC separation. Colors denote different glycan classes. Symbols: red triangle, fucose; blue square and white square, HexNAc; green circle, mannose; white circle, galactose. magenta diamond, sialic acid. Reproduced with permission from [53].

