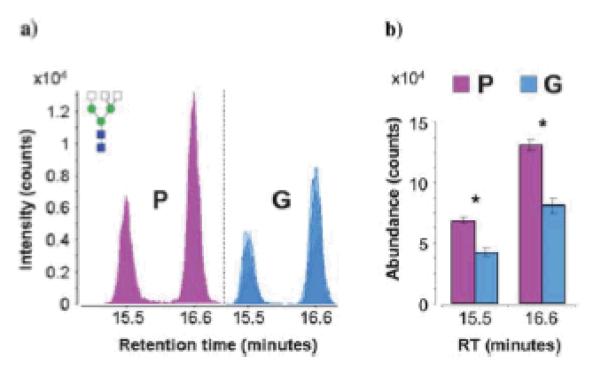
Figure 6.
(a) Overlaid chromatograms of the isomers of complex triantennary glycan composition Hex3-HexNAc5. Overlaps are represented by varying degrees of translucency. (b) Bar graph representation of average abundances and standard error for the isomers of Hex3-HexNAc5. Asterisks denote statistically significant differences between patient groups. Group P represents patients with poor prognoses based on elevated PSA levels post-radical retropubic prostatectomy (N=4), while Group G represents patients with good prognoses based on undetectable PSA levels post-radical retropubic prostatectomy (N=4). Symbos: as in Figure 5. Reproduced with permission from [53].

