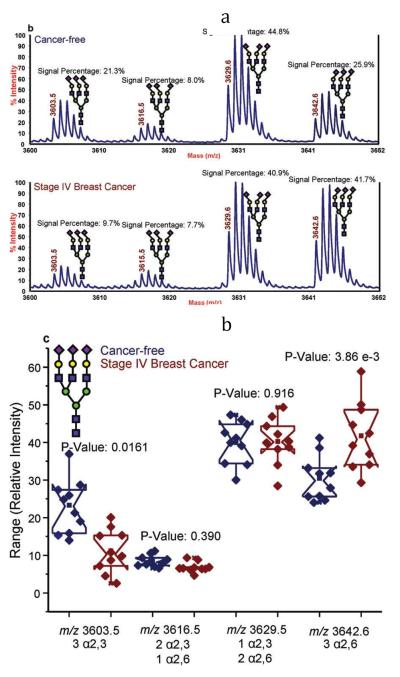
Figure 7.
(a) Representative MALDI-TOF-MS spectra of a cancer-free patient (top) and a breast cancer patient (bottom); and (b) notched-box plots for the different isomers associated with the triantennary-trisialylated glycan structures derived from the blood sera of the 10 cancer-free patients and 10 breast cancer patients. Symbols: as in Figure 1. In this figure, sialic acid directed toward the left are linked α2,3 while those directed toward the right are linked α2,6. Reproduced with permission from [54].

