
Figure 3.
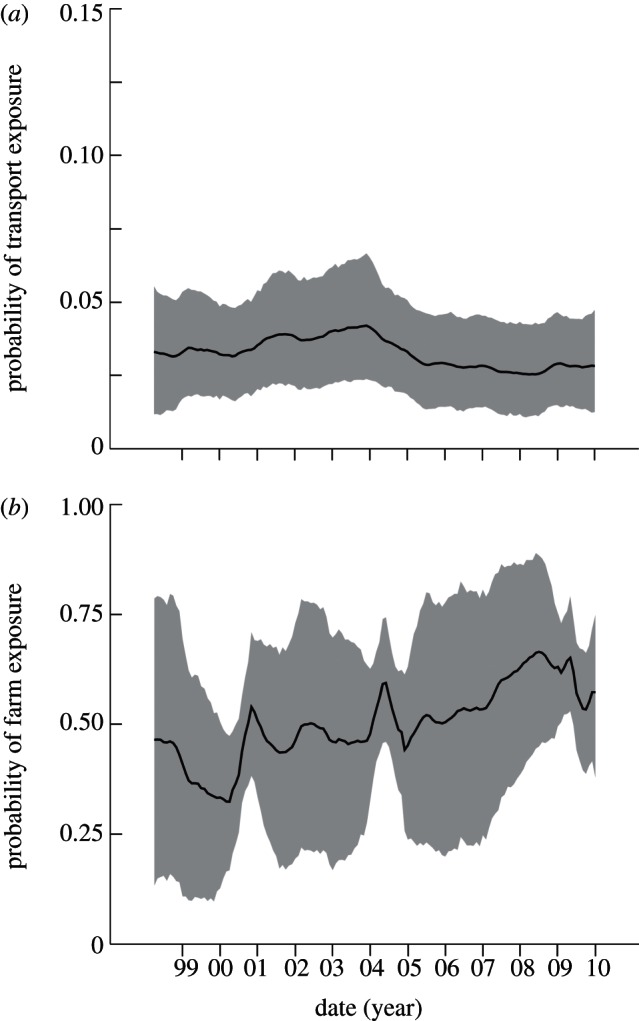
Total probabilities of exposure during (a) transport and holding in the week before slaughter (pt(t)), and (b) earlier life on the swine farm or production facility (pf(t)). Inferred values for each month are plotted. The solid black lines show the posterior means of the probabilities and the grey bands show the 95% HPD regions. No data are shown because these transmission dynamics are not directly observed.