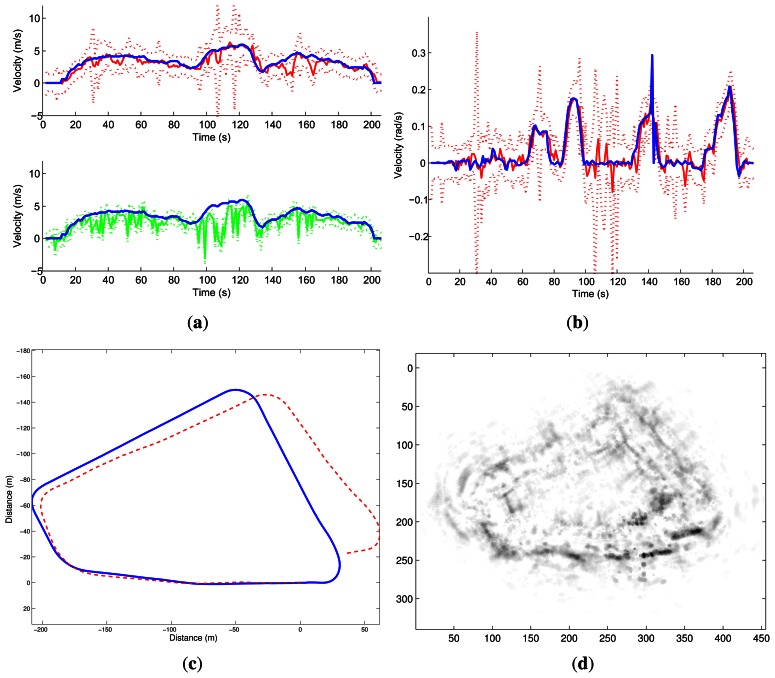
Figure 21.
IMPALA odometry results in dynamic environment. (a) Linear velocity estimation: in blue the ground truth plotted on the two graphs, in green the Doppler estimation and in red the odometry estimation, both plotted with their respective uncertainty; (b) Angular velocity estimation (in red) along with ground truth (c) Estimated trajectories: in red the IMPALA odometry and in blue the ground truth; (d) Map obtained based on the trajectory solution.

