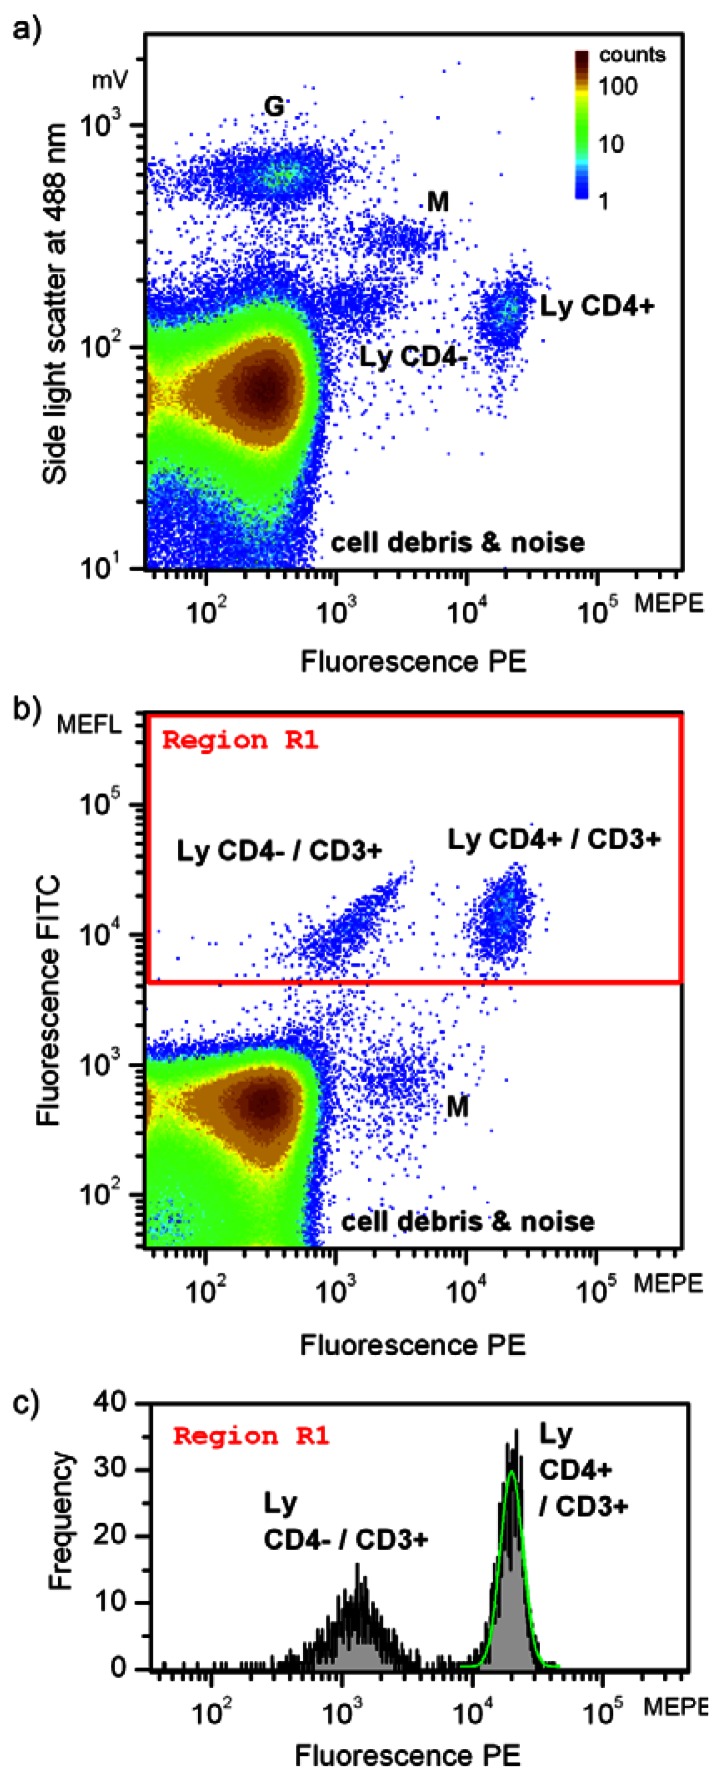
Figure 6.
Three-parameter measurement of a blood sample labeled with anti-CD3-FITC and anti-CD4-PE antibodies specific for staining subpopulation of the T-lymphocytes (Ly). The number of events in the scatterplots (a) side light scatter vs. PE fluorescence and (b) FITC fluorescence vs. PE fluorescence are given in false colors. Subpopulations of leukocytes are labeled as G—granulocytes and M—monocytes. The histogram depicted in (c) represents events in “Region 1” of the scatterplot FITC fluorescence vs. PE fluorescence in (b). Intensity distributions of the subpopulation of CD3 positive and CD4 positive lymphocytes were fitted with lognormal distributions (marked with green contour) to derive the number of events (total number of events is 8390912 (a,b), and 2694 in region R1 (c)). Fluorescence intensities are given in MEFL (molecules of equivalent fluorescein) and MEPE (molecules of equivalent PE) units.

