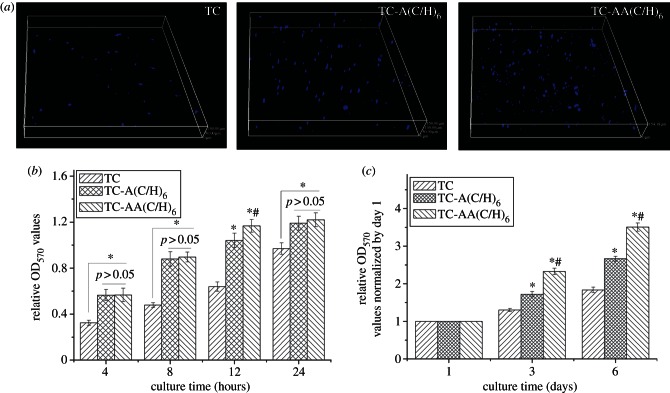
Figure 5.
Attachment and proliferation of hMSCs on the surfaces of the three different samples. (a) Cells stained with DAPI after 12 h of incubation. (b) The adhesion was measured using a colorimetric MTT assay. (c) The relative proliferation rate of hMSCs, measured by OD values at days 3 and 6, was normalized to day 1. *p < 0.05 denotes differences compared between modified TCs (TC-A(C/H)6 and TC-AA(C/H)6) and TC. #p < 0.05 denotes differences compared between TC-A(C/H)6 and TC-AA(C/H)6.

