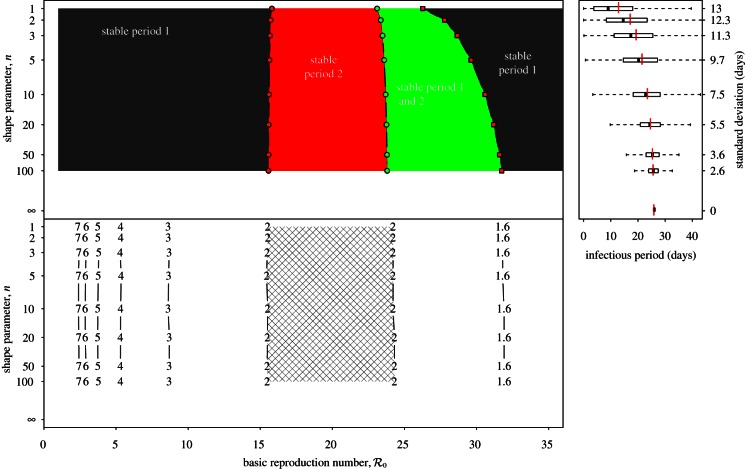
Figure 11.
Two-parameter bifurcation diagram and transient-period contour plot for the measles SInR model with fixed mean generation time, Tgen = 13 days. Annotation is as in figure 6. Note that the main period-doubling bifurcation point from annual to biennial cycle occurs for approximately the same value of  regardless of the shape (n) of the infectious period distribution. The bottom panel shows that the transient period associated with the annual cycle is almost exactly the same for all values of n, i.e. this transient period is almost independent of the shape of the generation time distribution. (Online version in colour.)

