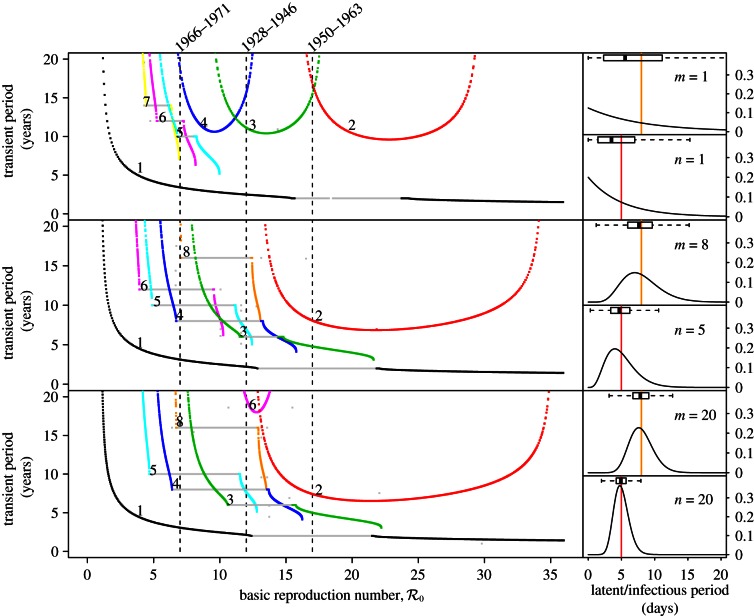
Figure 8.
Transient dynamics of the measles SEmInR model for (m,n) = (1,1), (8,5) and (20,20) as a function of  . Each panel shows the transient periods associated with the periodic attractors shown in figure 7. Transient period curves are labelled according to the periods of the attractors they reach asymptotically (and in the online version are coloured according to the corresponding attractor in figure 7). Light grey lines indicate regions of
  where the corresponding periodic cycles exist but are unstable. Dashed vertical lines correspond to values of
  , 12 and 17. As in figure 7, the right panels show the associated latent and infectious period distributions. (Online version in colour.)

